User Guide
Welcome to marketSnack
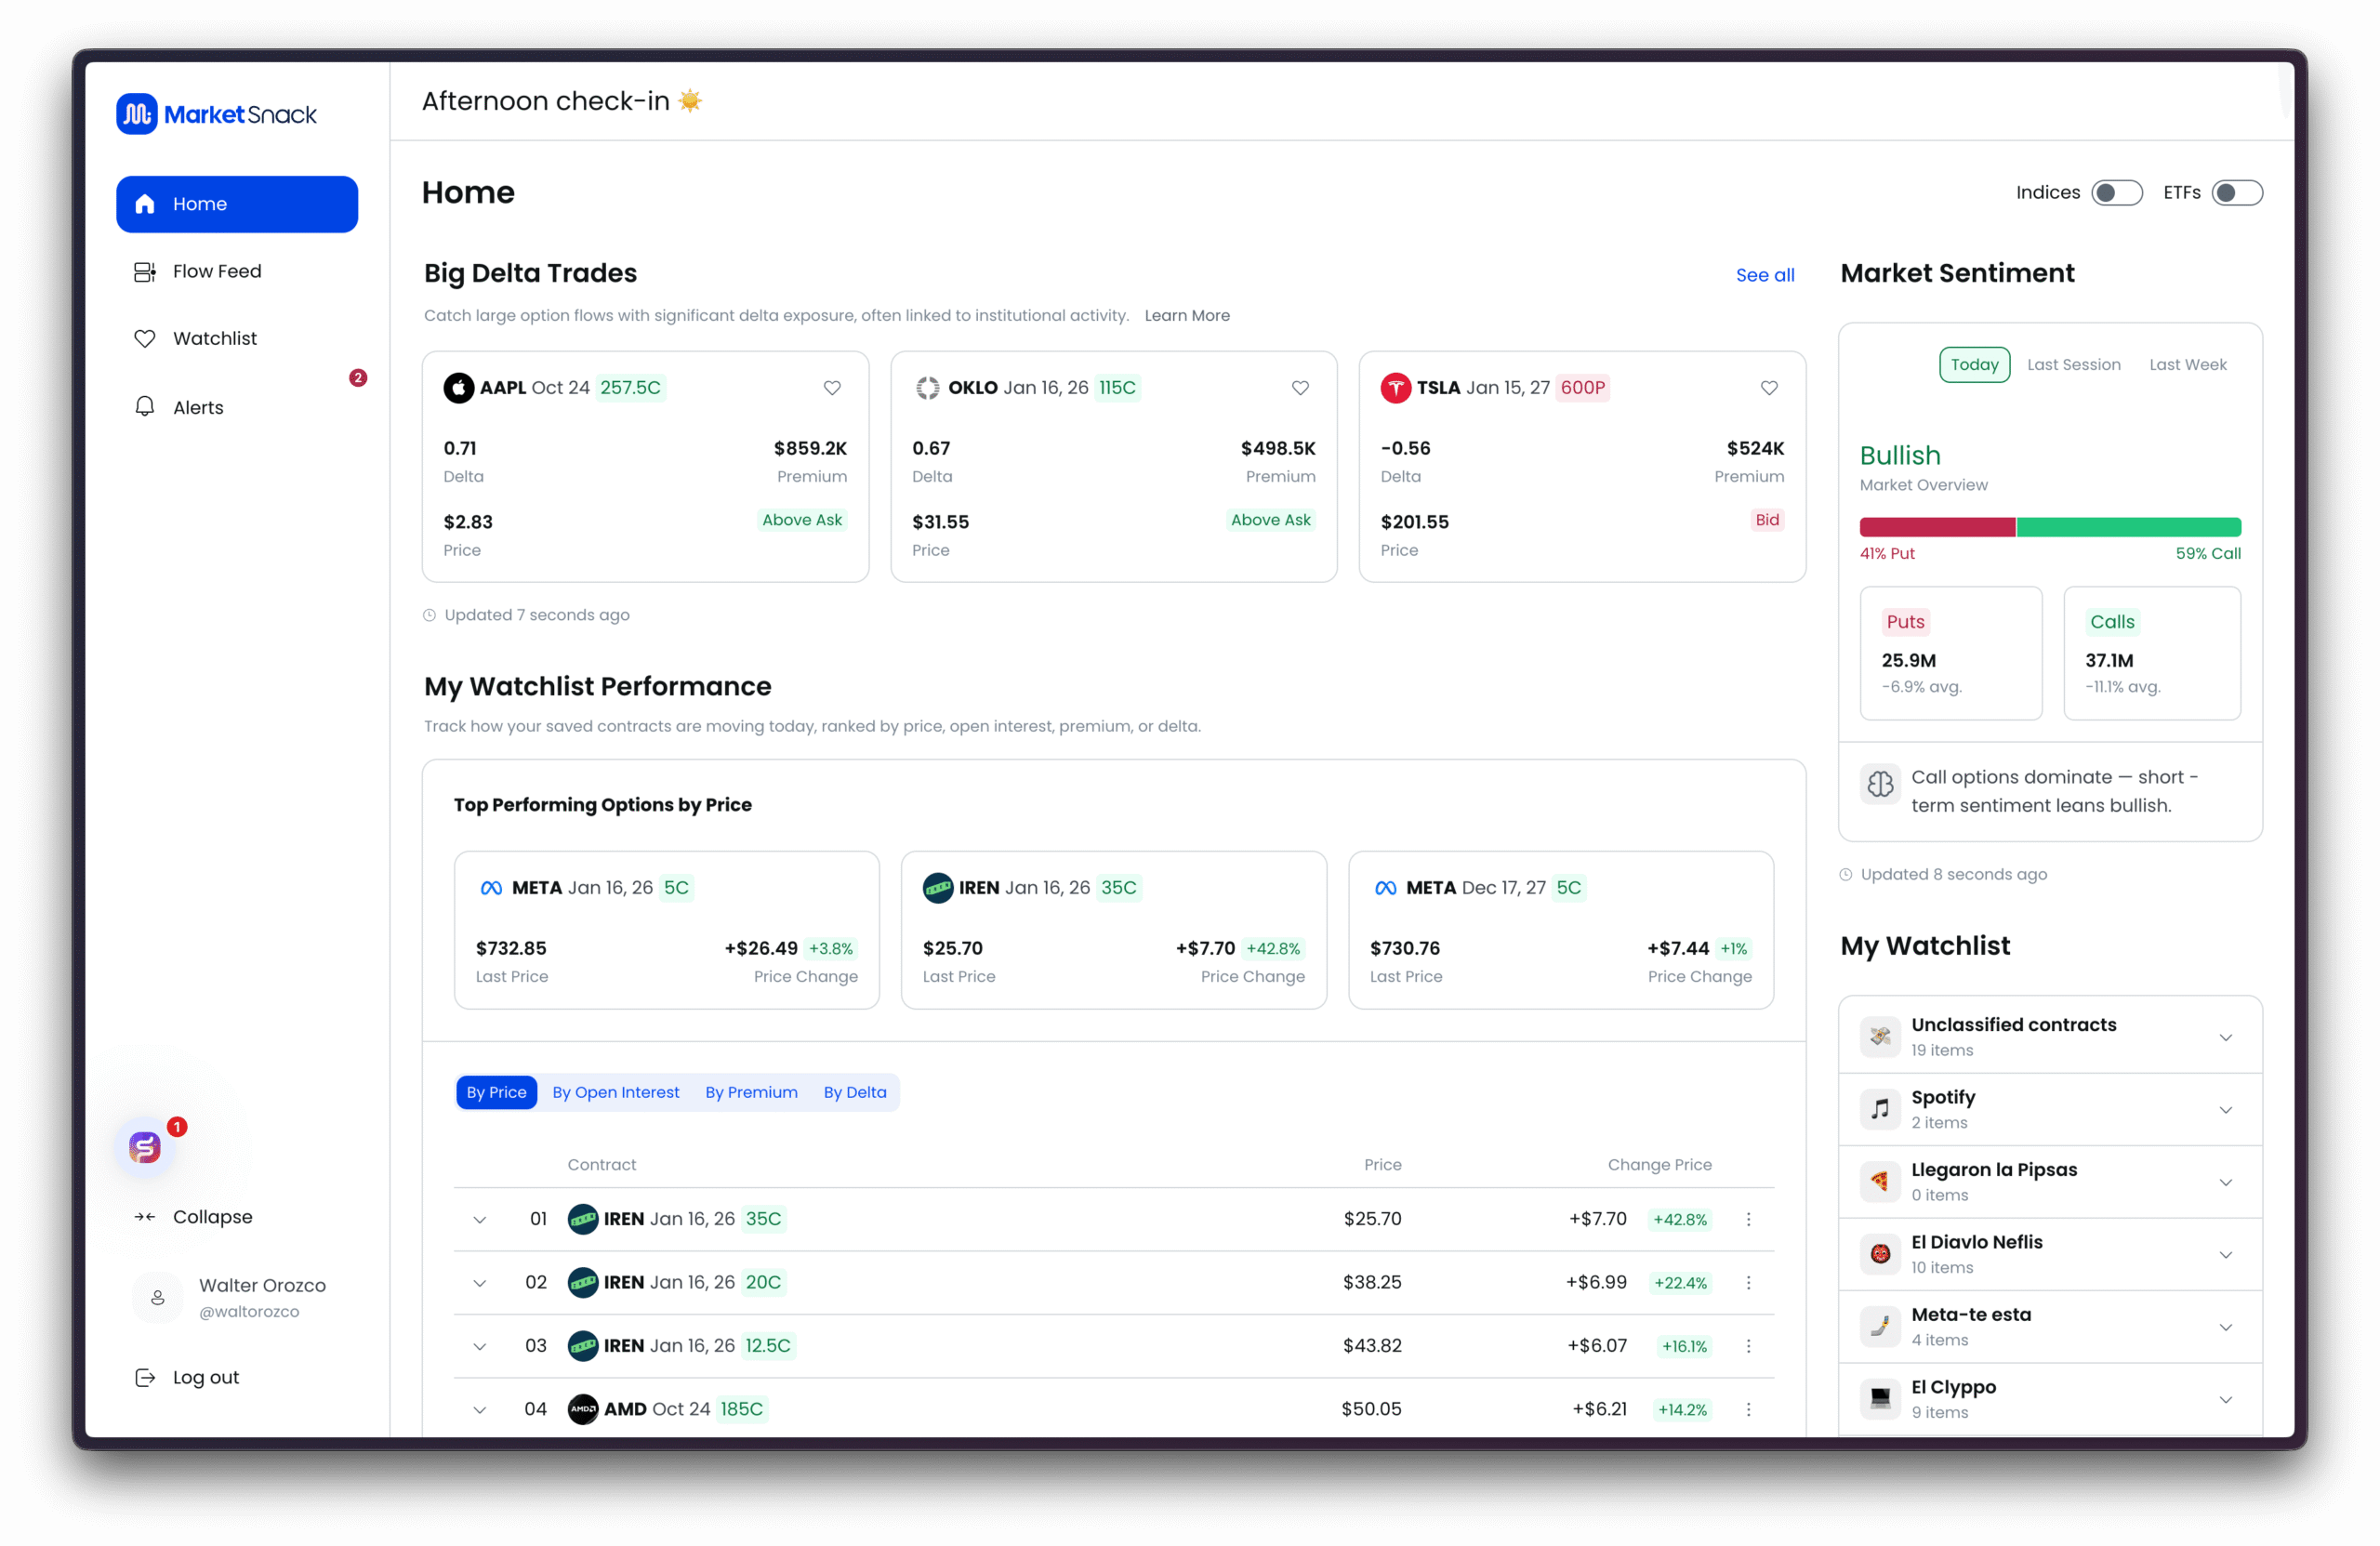
Market Snack Dashboard
What will you find in the dashboard?
Market Sentiment
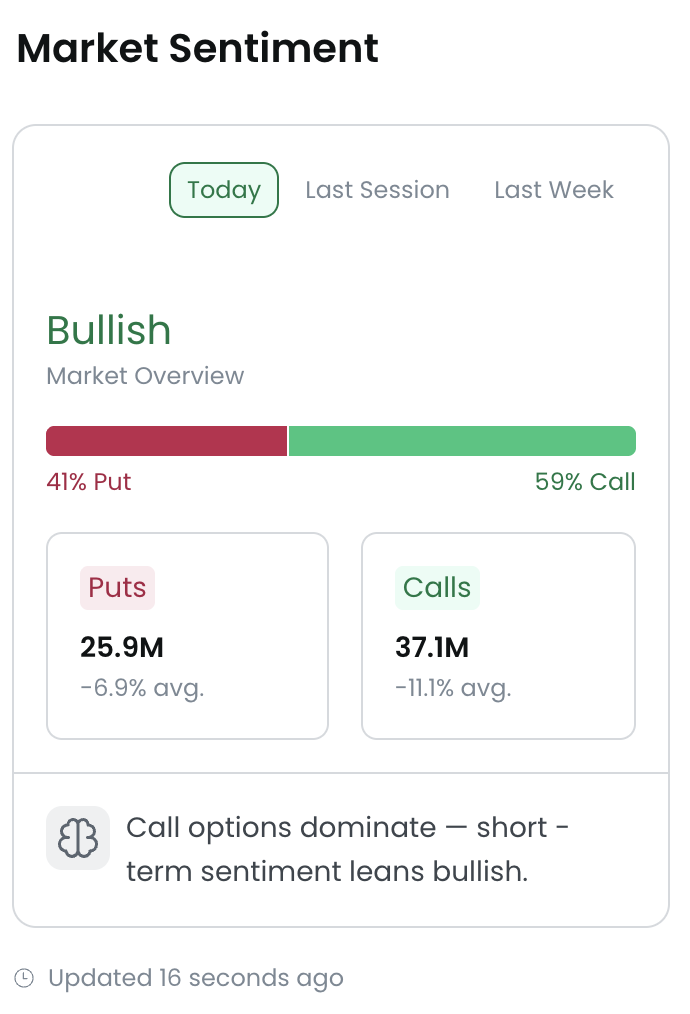
The Market Sentiment feature summarizes the overall market pulse using multiple underlying metrics. It provides a quick, at-a-glance indication of whether sentiment is leaning bullish or bearish, helping traders put their session decisions into context.
Beyond the current day, you can also explore sentiment historically:
● Today
● Last session
● Last week

This allows you to compare today’s market sentiment against prior sessions and spot short-term shifts or trends in market behavior.
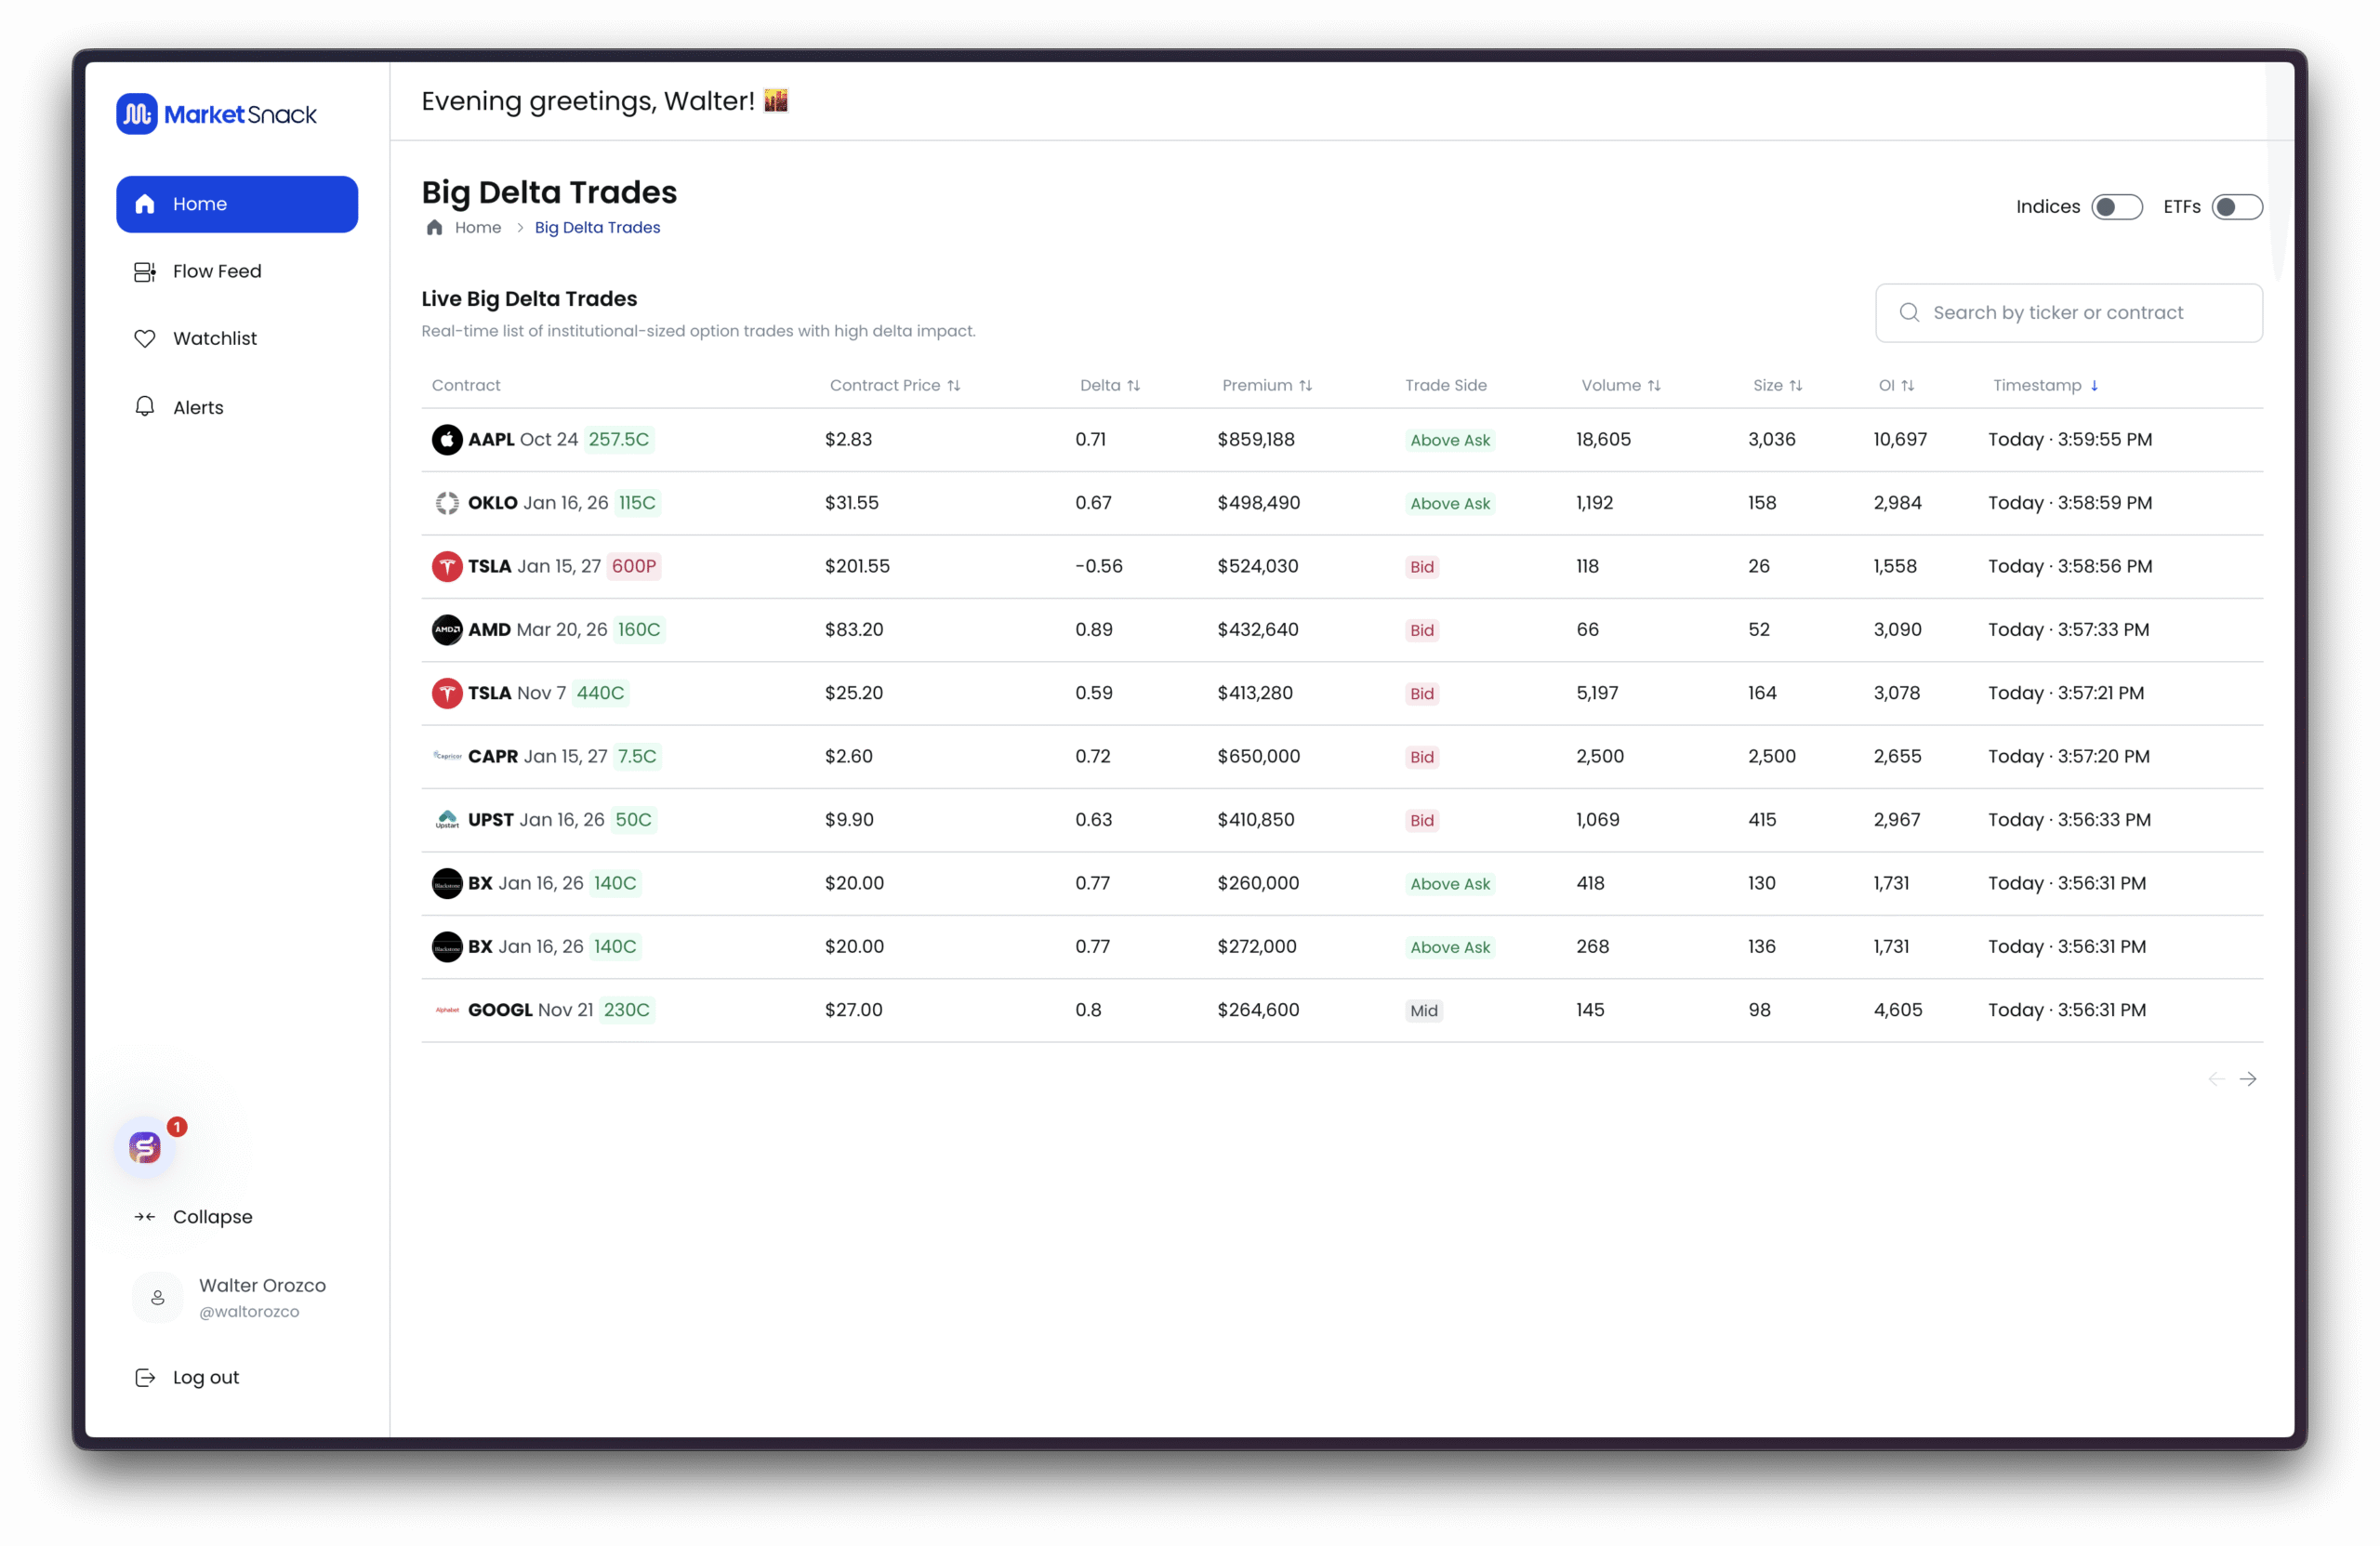
Big Delta Trades
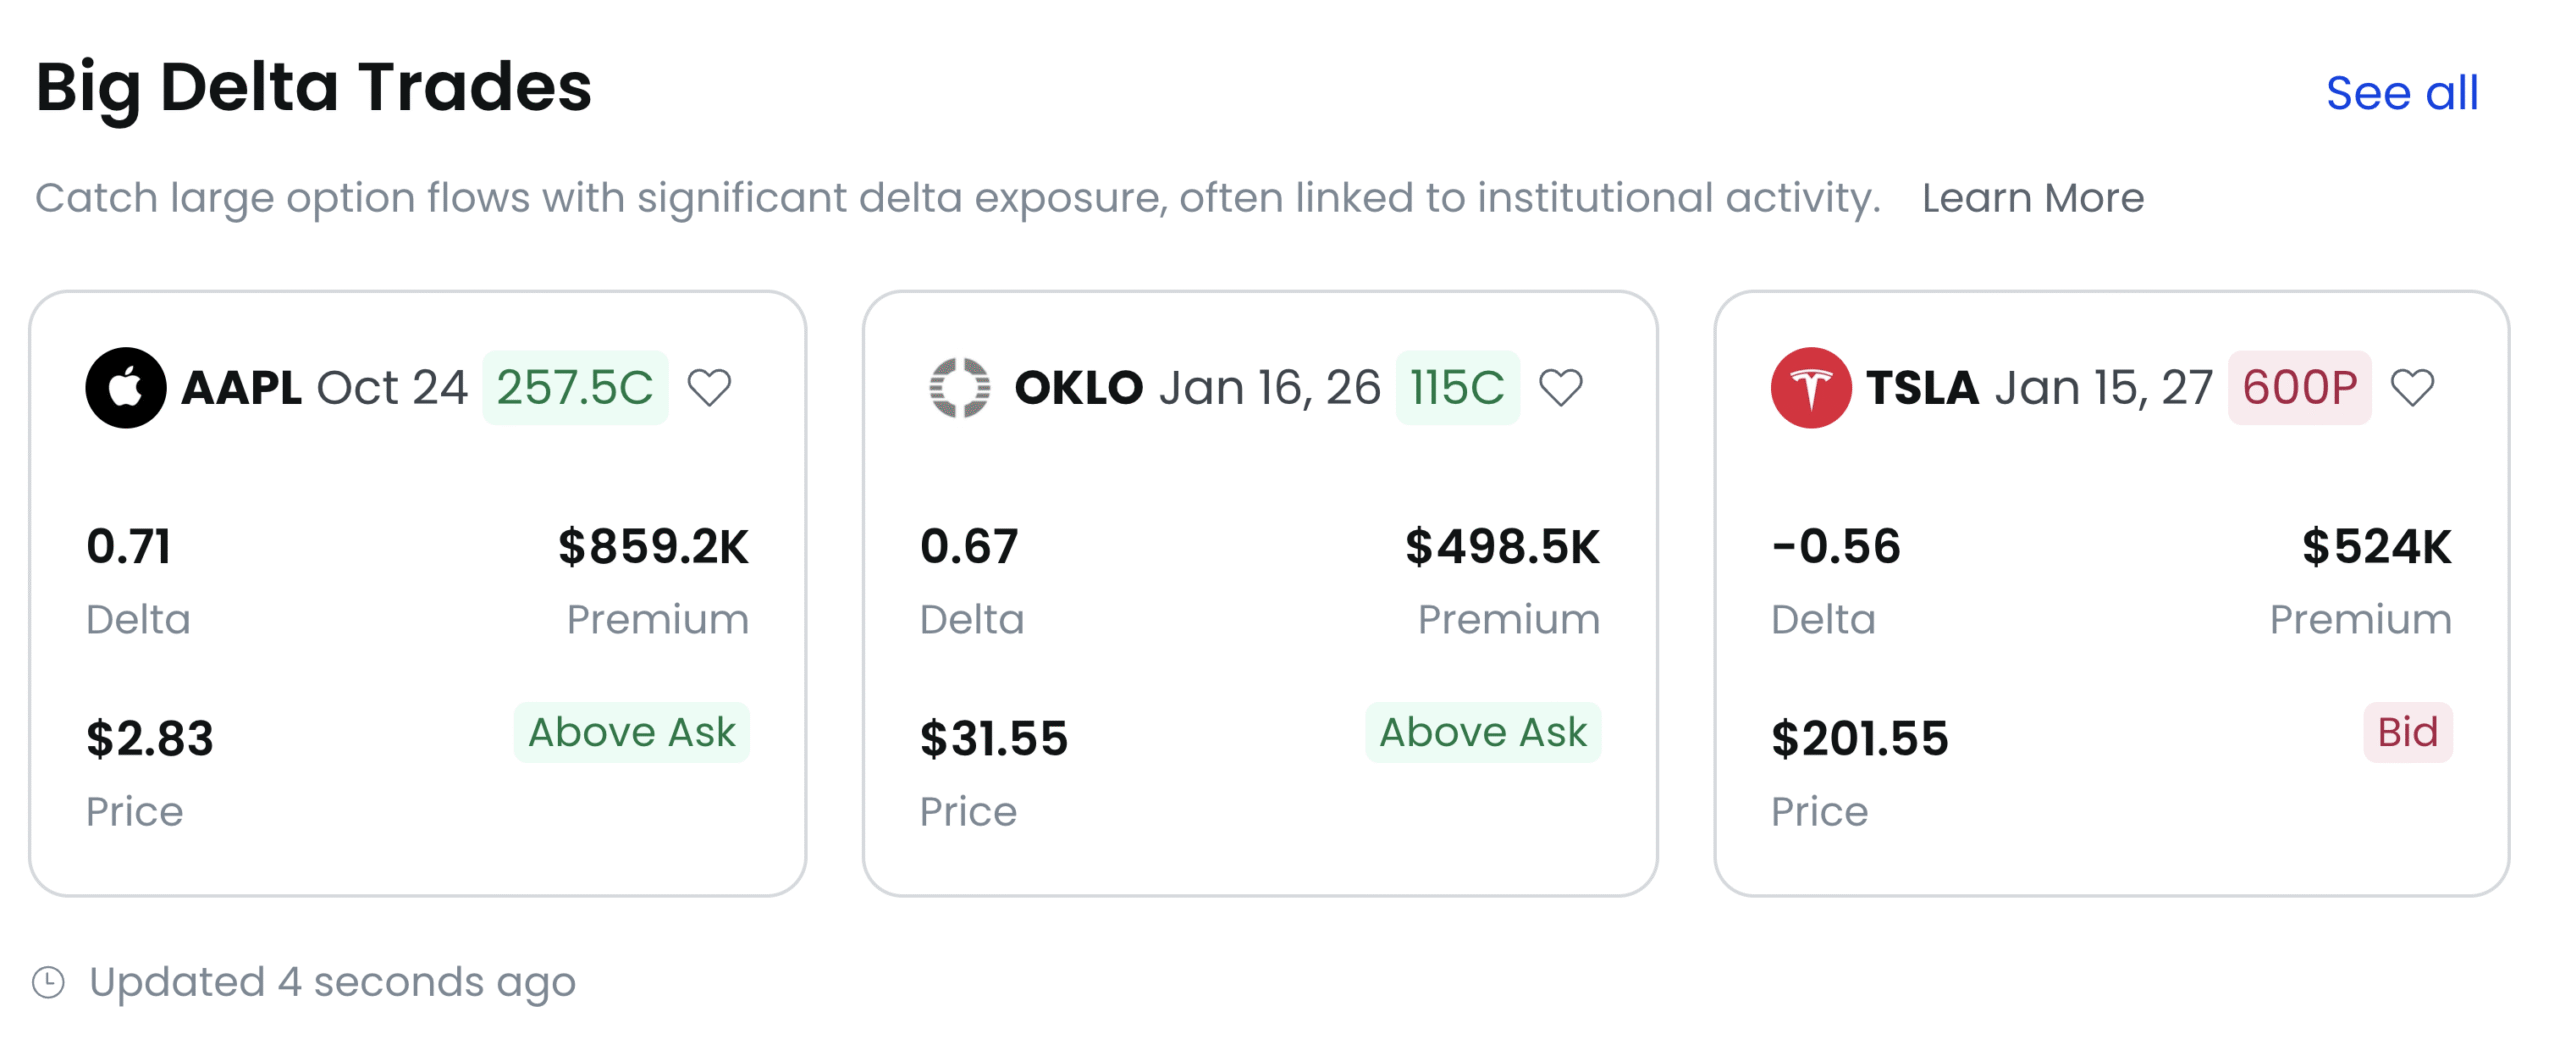
The Big Delta Trades feature highlights option market transactions with unusually high delta values. These trades are often linked to large institutional participants seeking significant directional exposure. Monitoring them can help identify unusual flows and anticipate sharp movements in the underlying assets.
For deeper exploration, you can click “See All” to view the complete list of Big Delta Trades, beyond the initial snapshot.
My Watchlist Performance
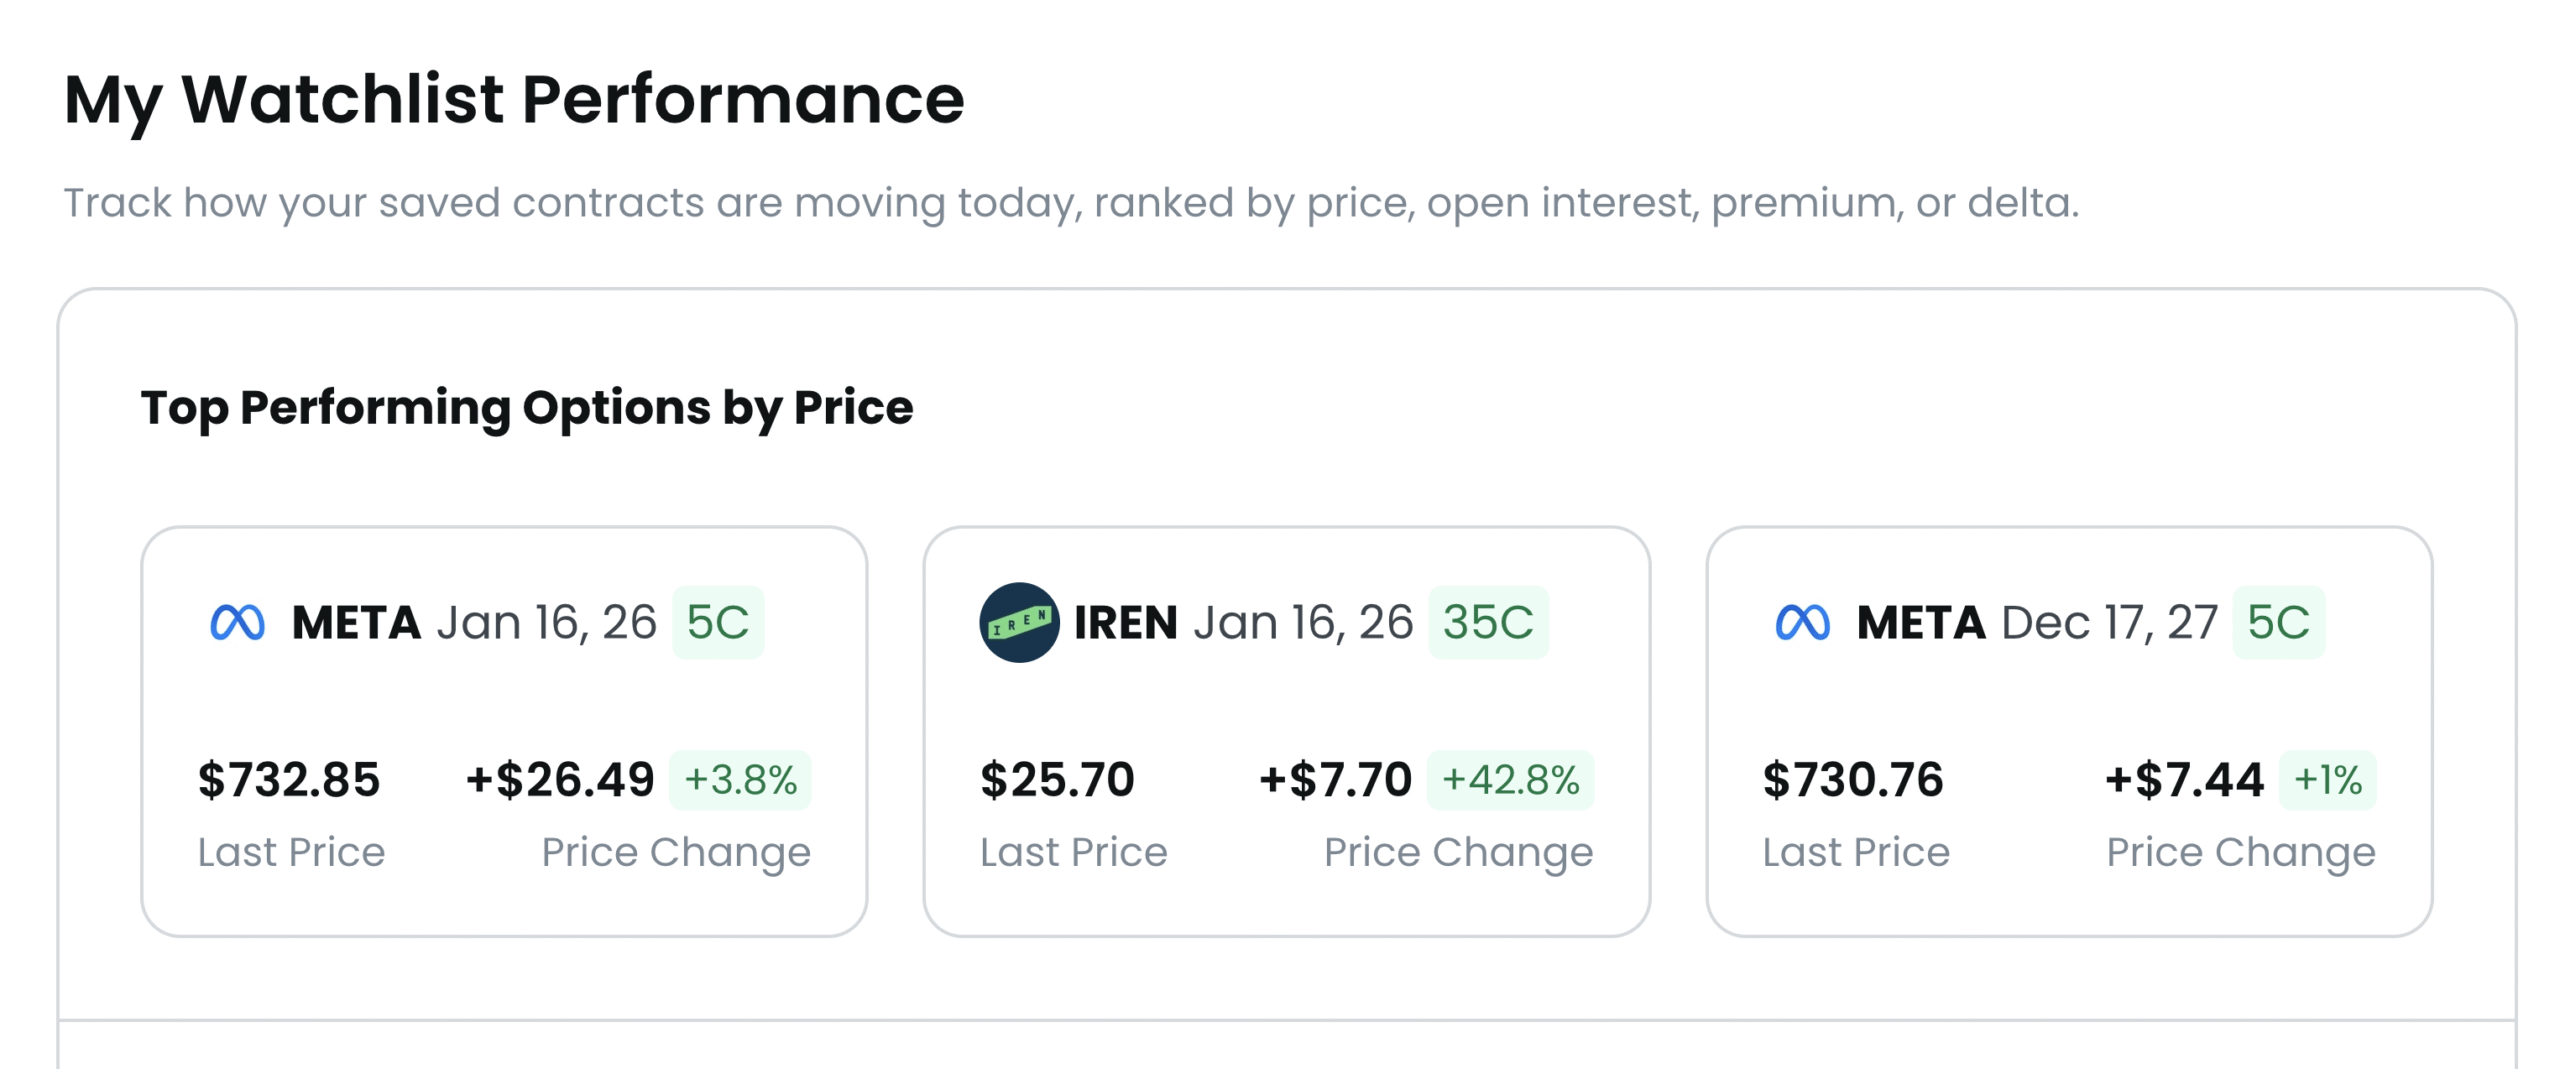
The My Watchlist Performance feature displays the performance of assets you are tracking in your personalized list. It helps you quickly identify leaders and laggards within your portfolio of interest, making it easier to monitor and compare different symbols in real time.
You can filter performance across your entire watchlist of option contracts based on:
● Price
● Open Interest
● Premium
● Delta
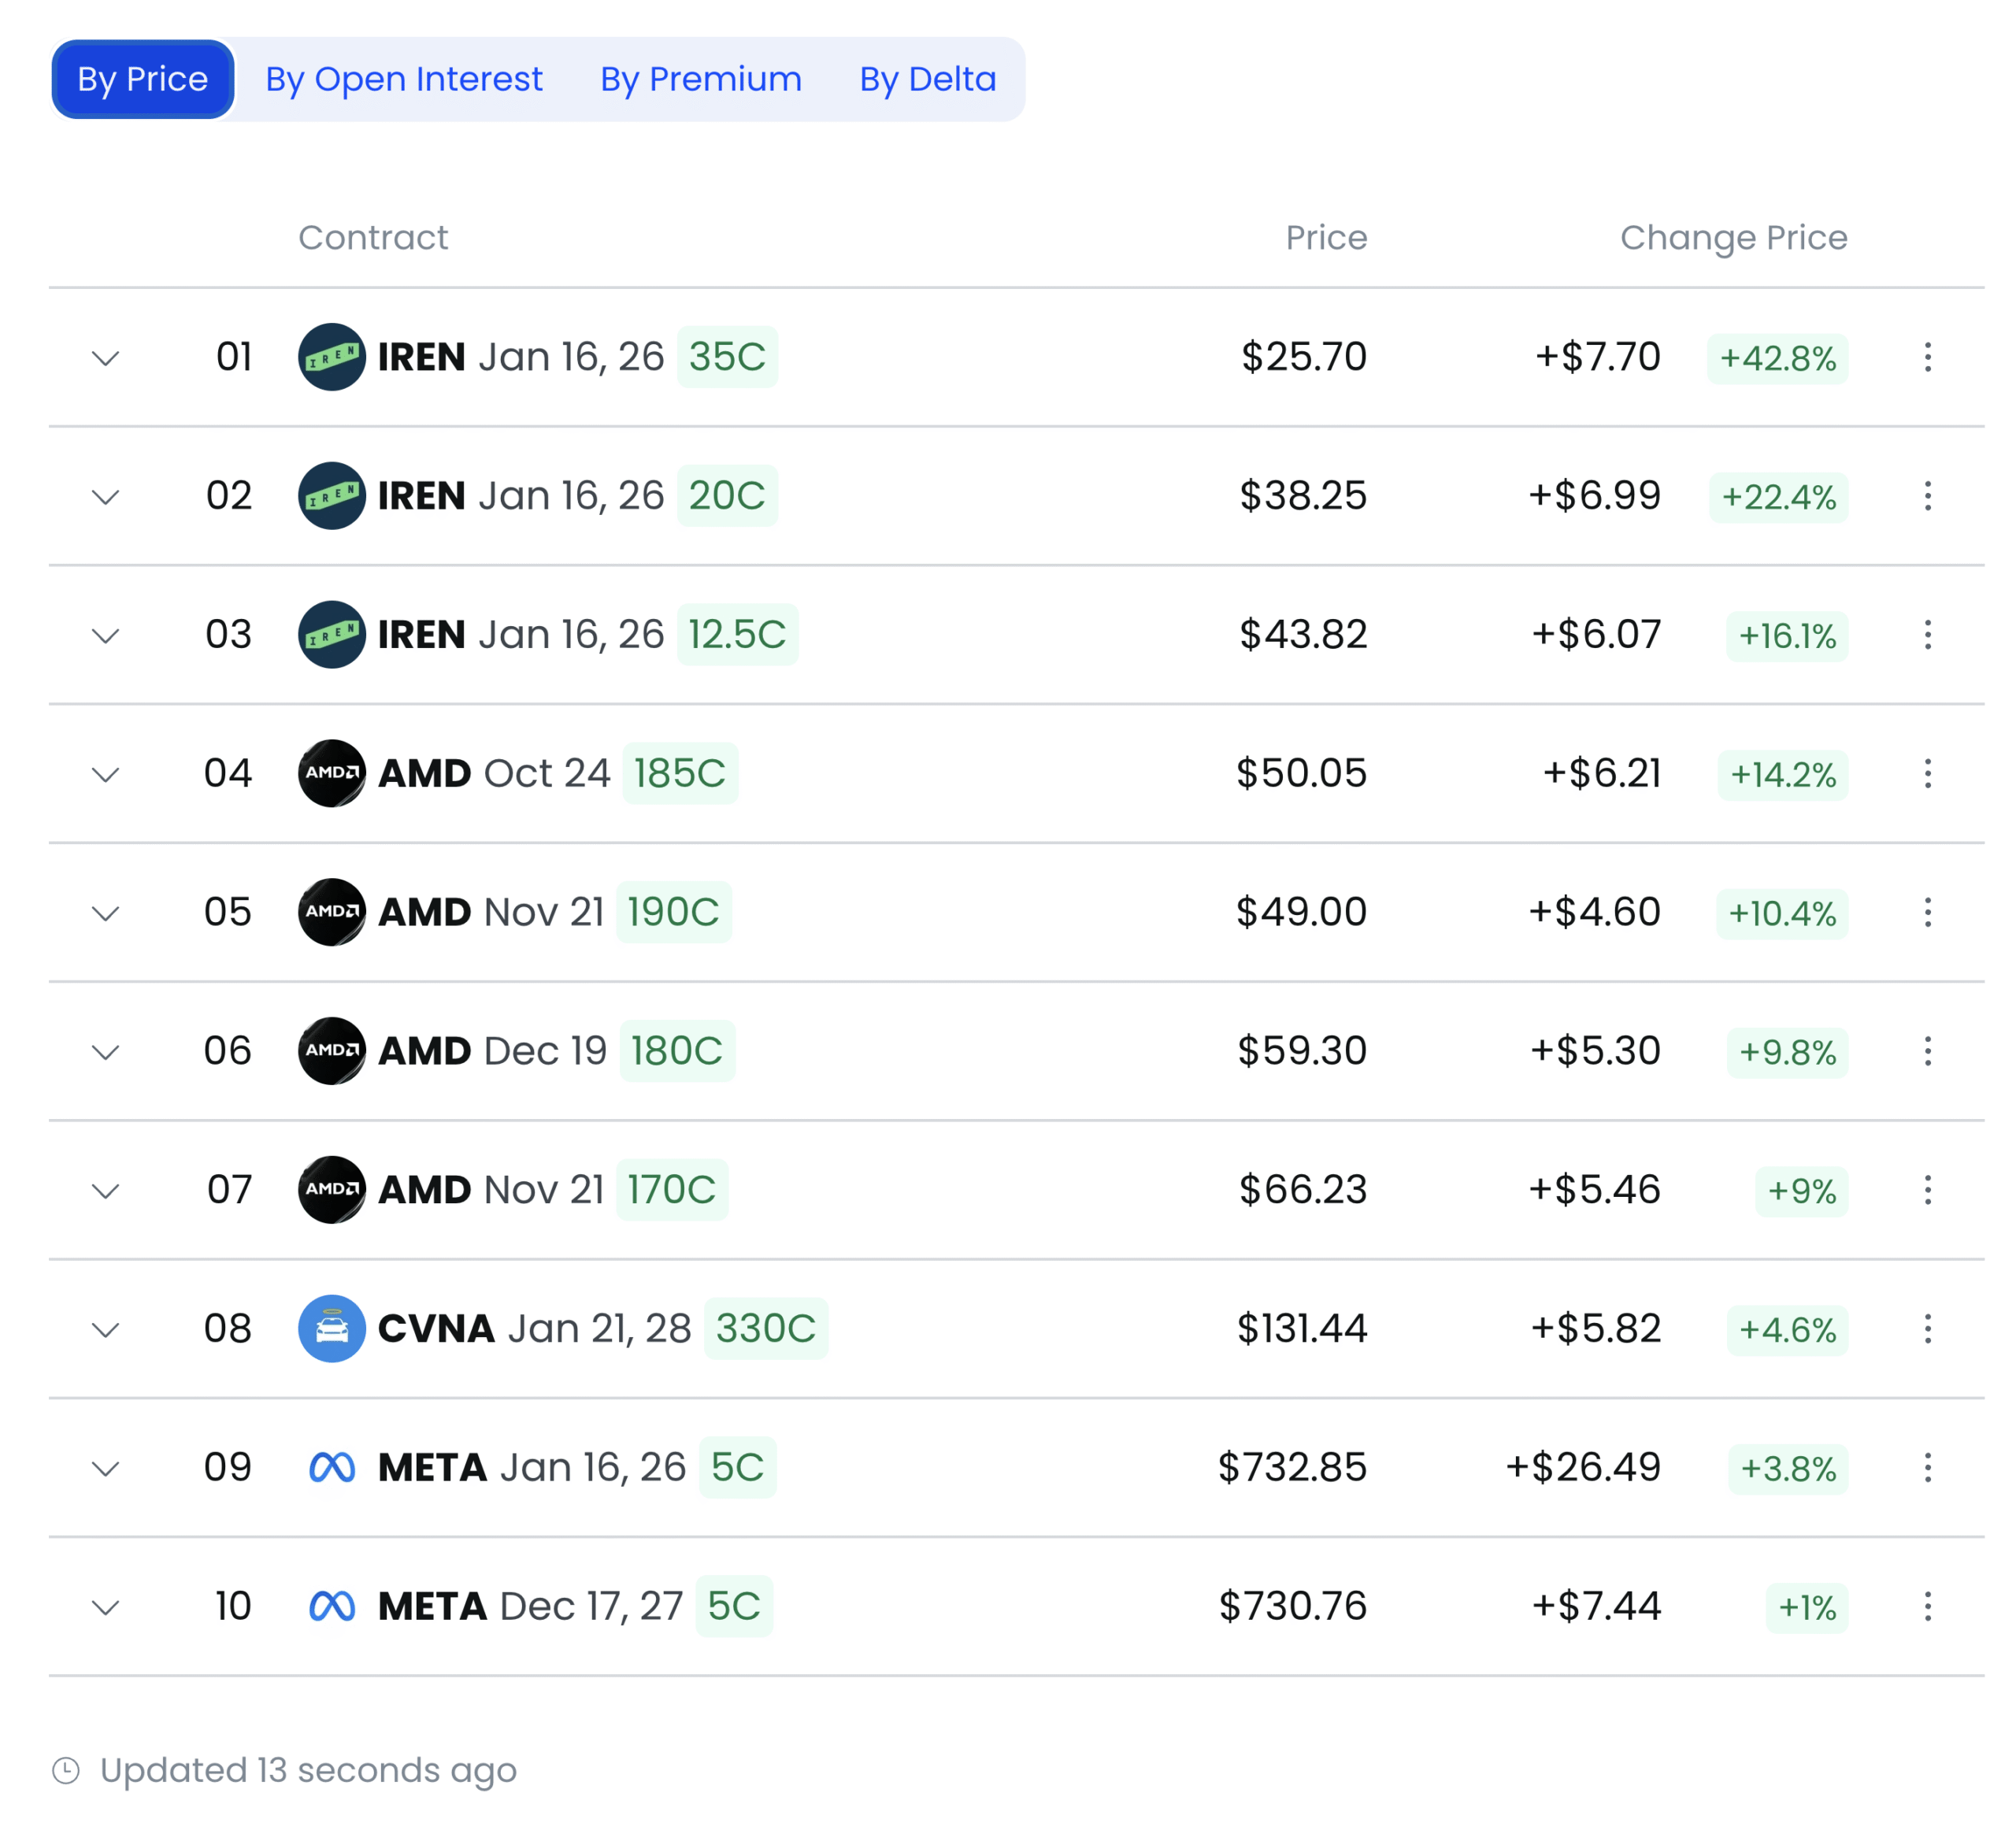
Depending on the filter selected, the list will automatically reorder so that the top and bottom performers are ranked according to that specific metric. This makes it easy to shift perspective and analyze your watchlist from multiple angles with just a click.
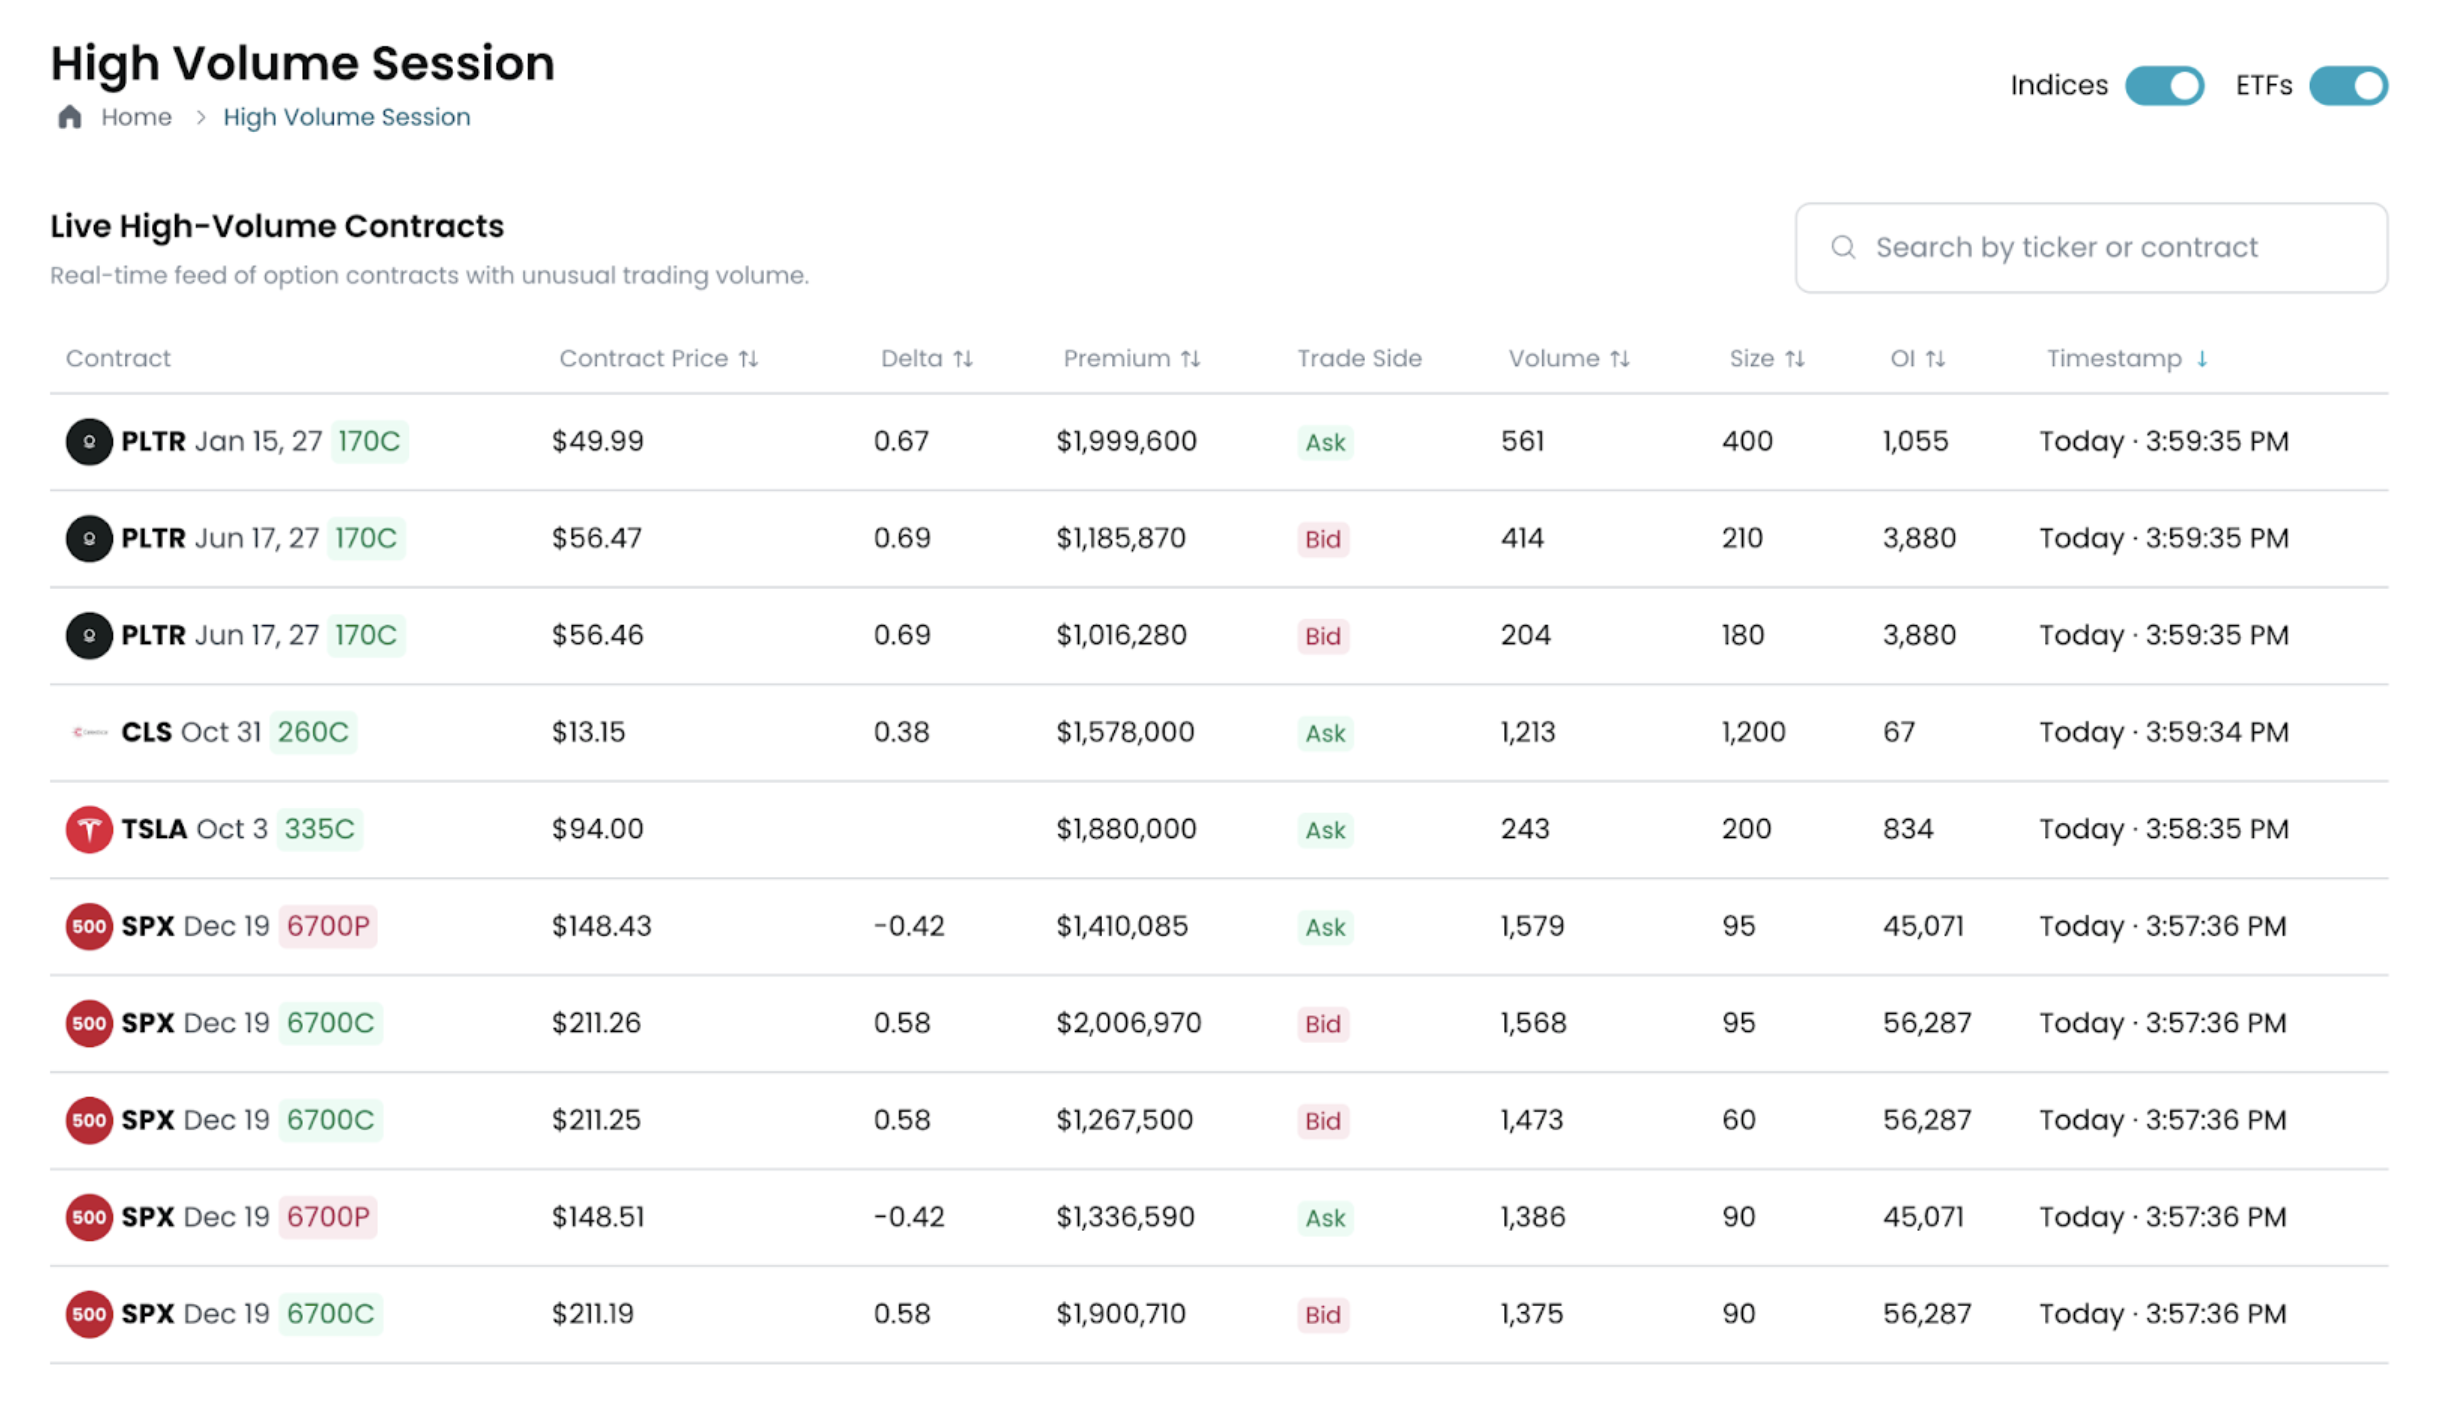
High Volume Session
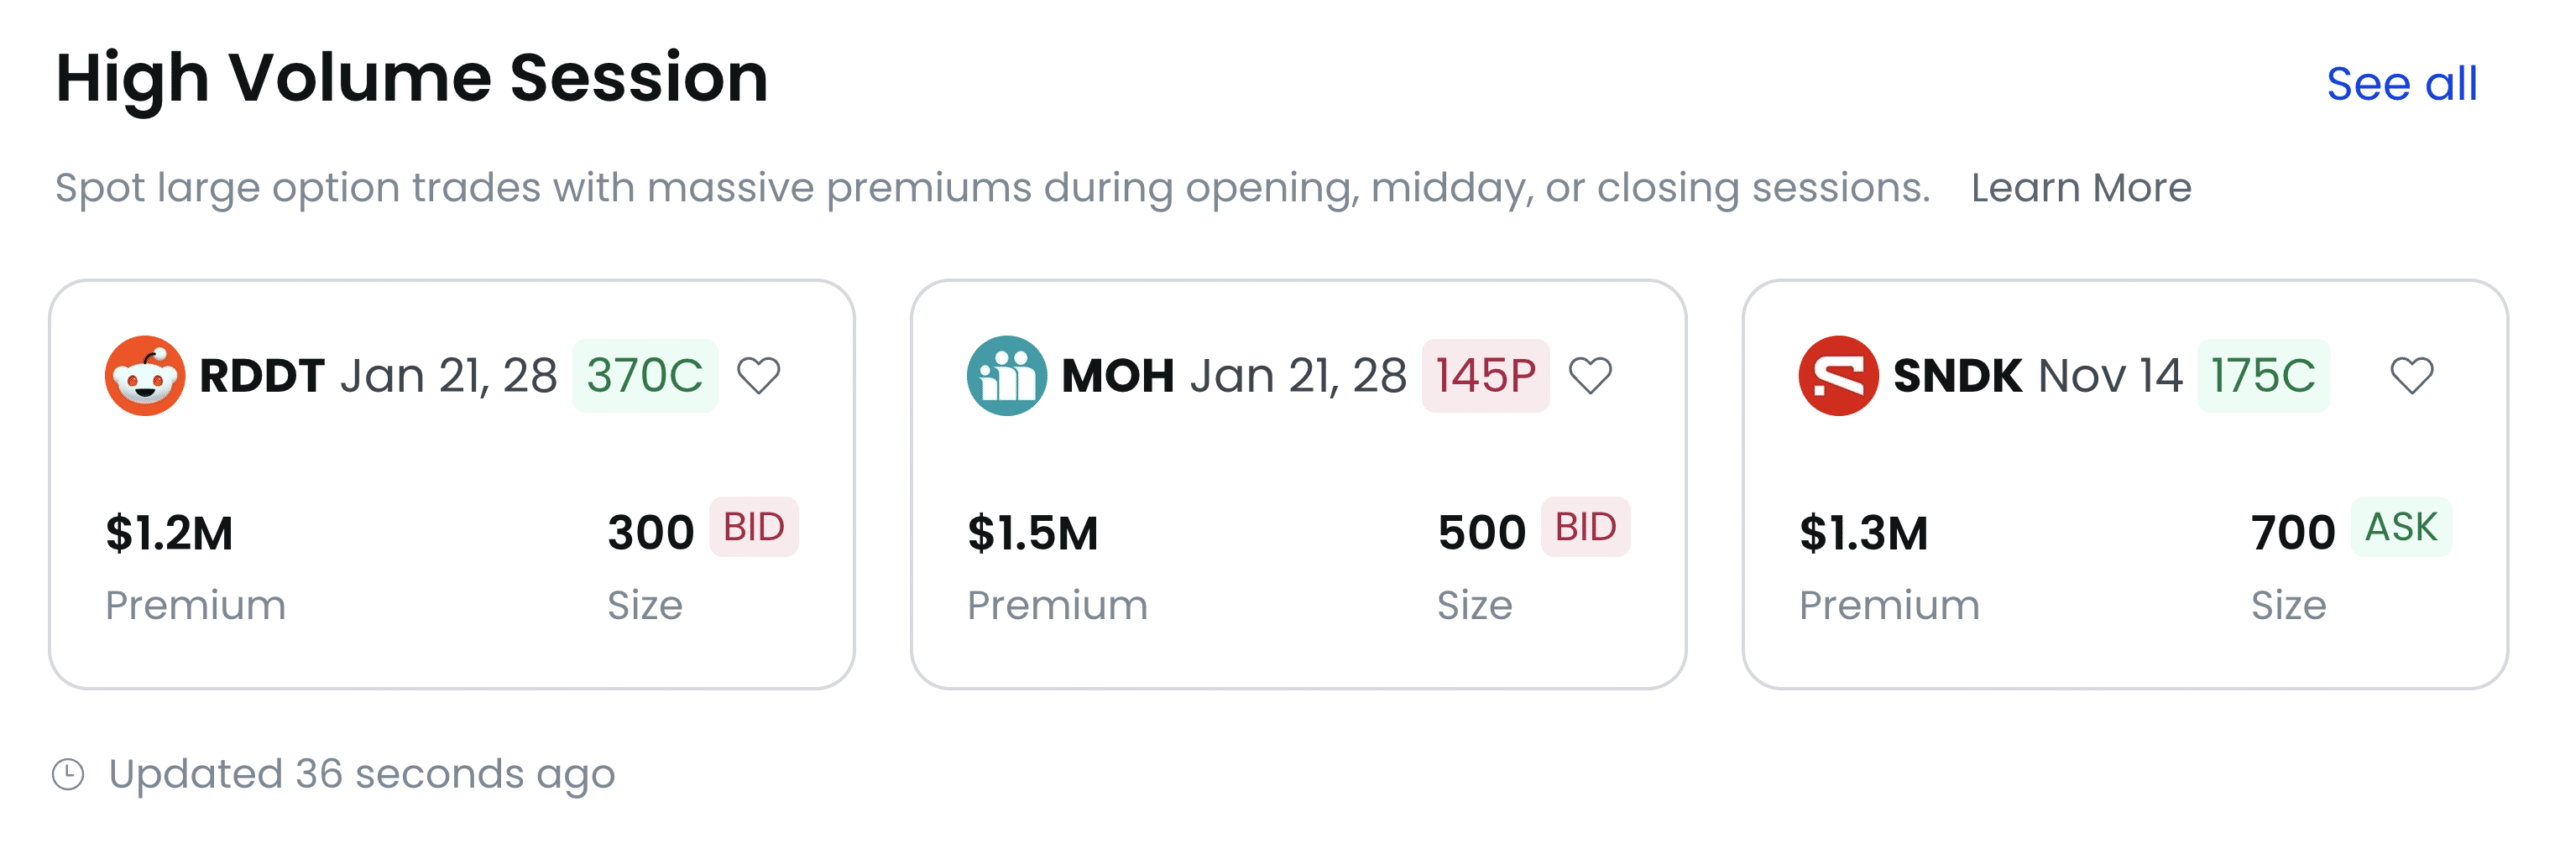
The High Volume Session feature highlights the assets with the highest trading volume during the current session. Elevated volume often signals the presence of institutional activity or market-moving news that is driving concentrated interest.
Use this tool to quickly spot where market participation is clustering, helping you identify potential opportunities or risks as liquidity shifts toward specific names.
Just like with Big Delta Trades, you can click “See All” to access the full list of high-volume assets for that session, beyond the initial snapshot. This makes it easy to explore all relevant activity in one place.
Large Spreads
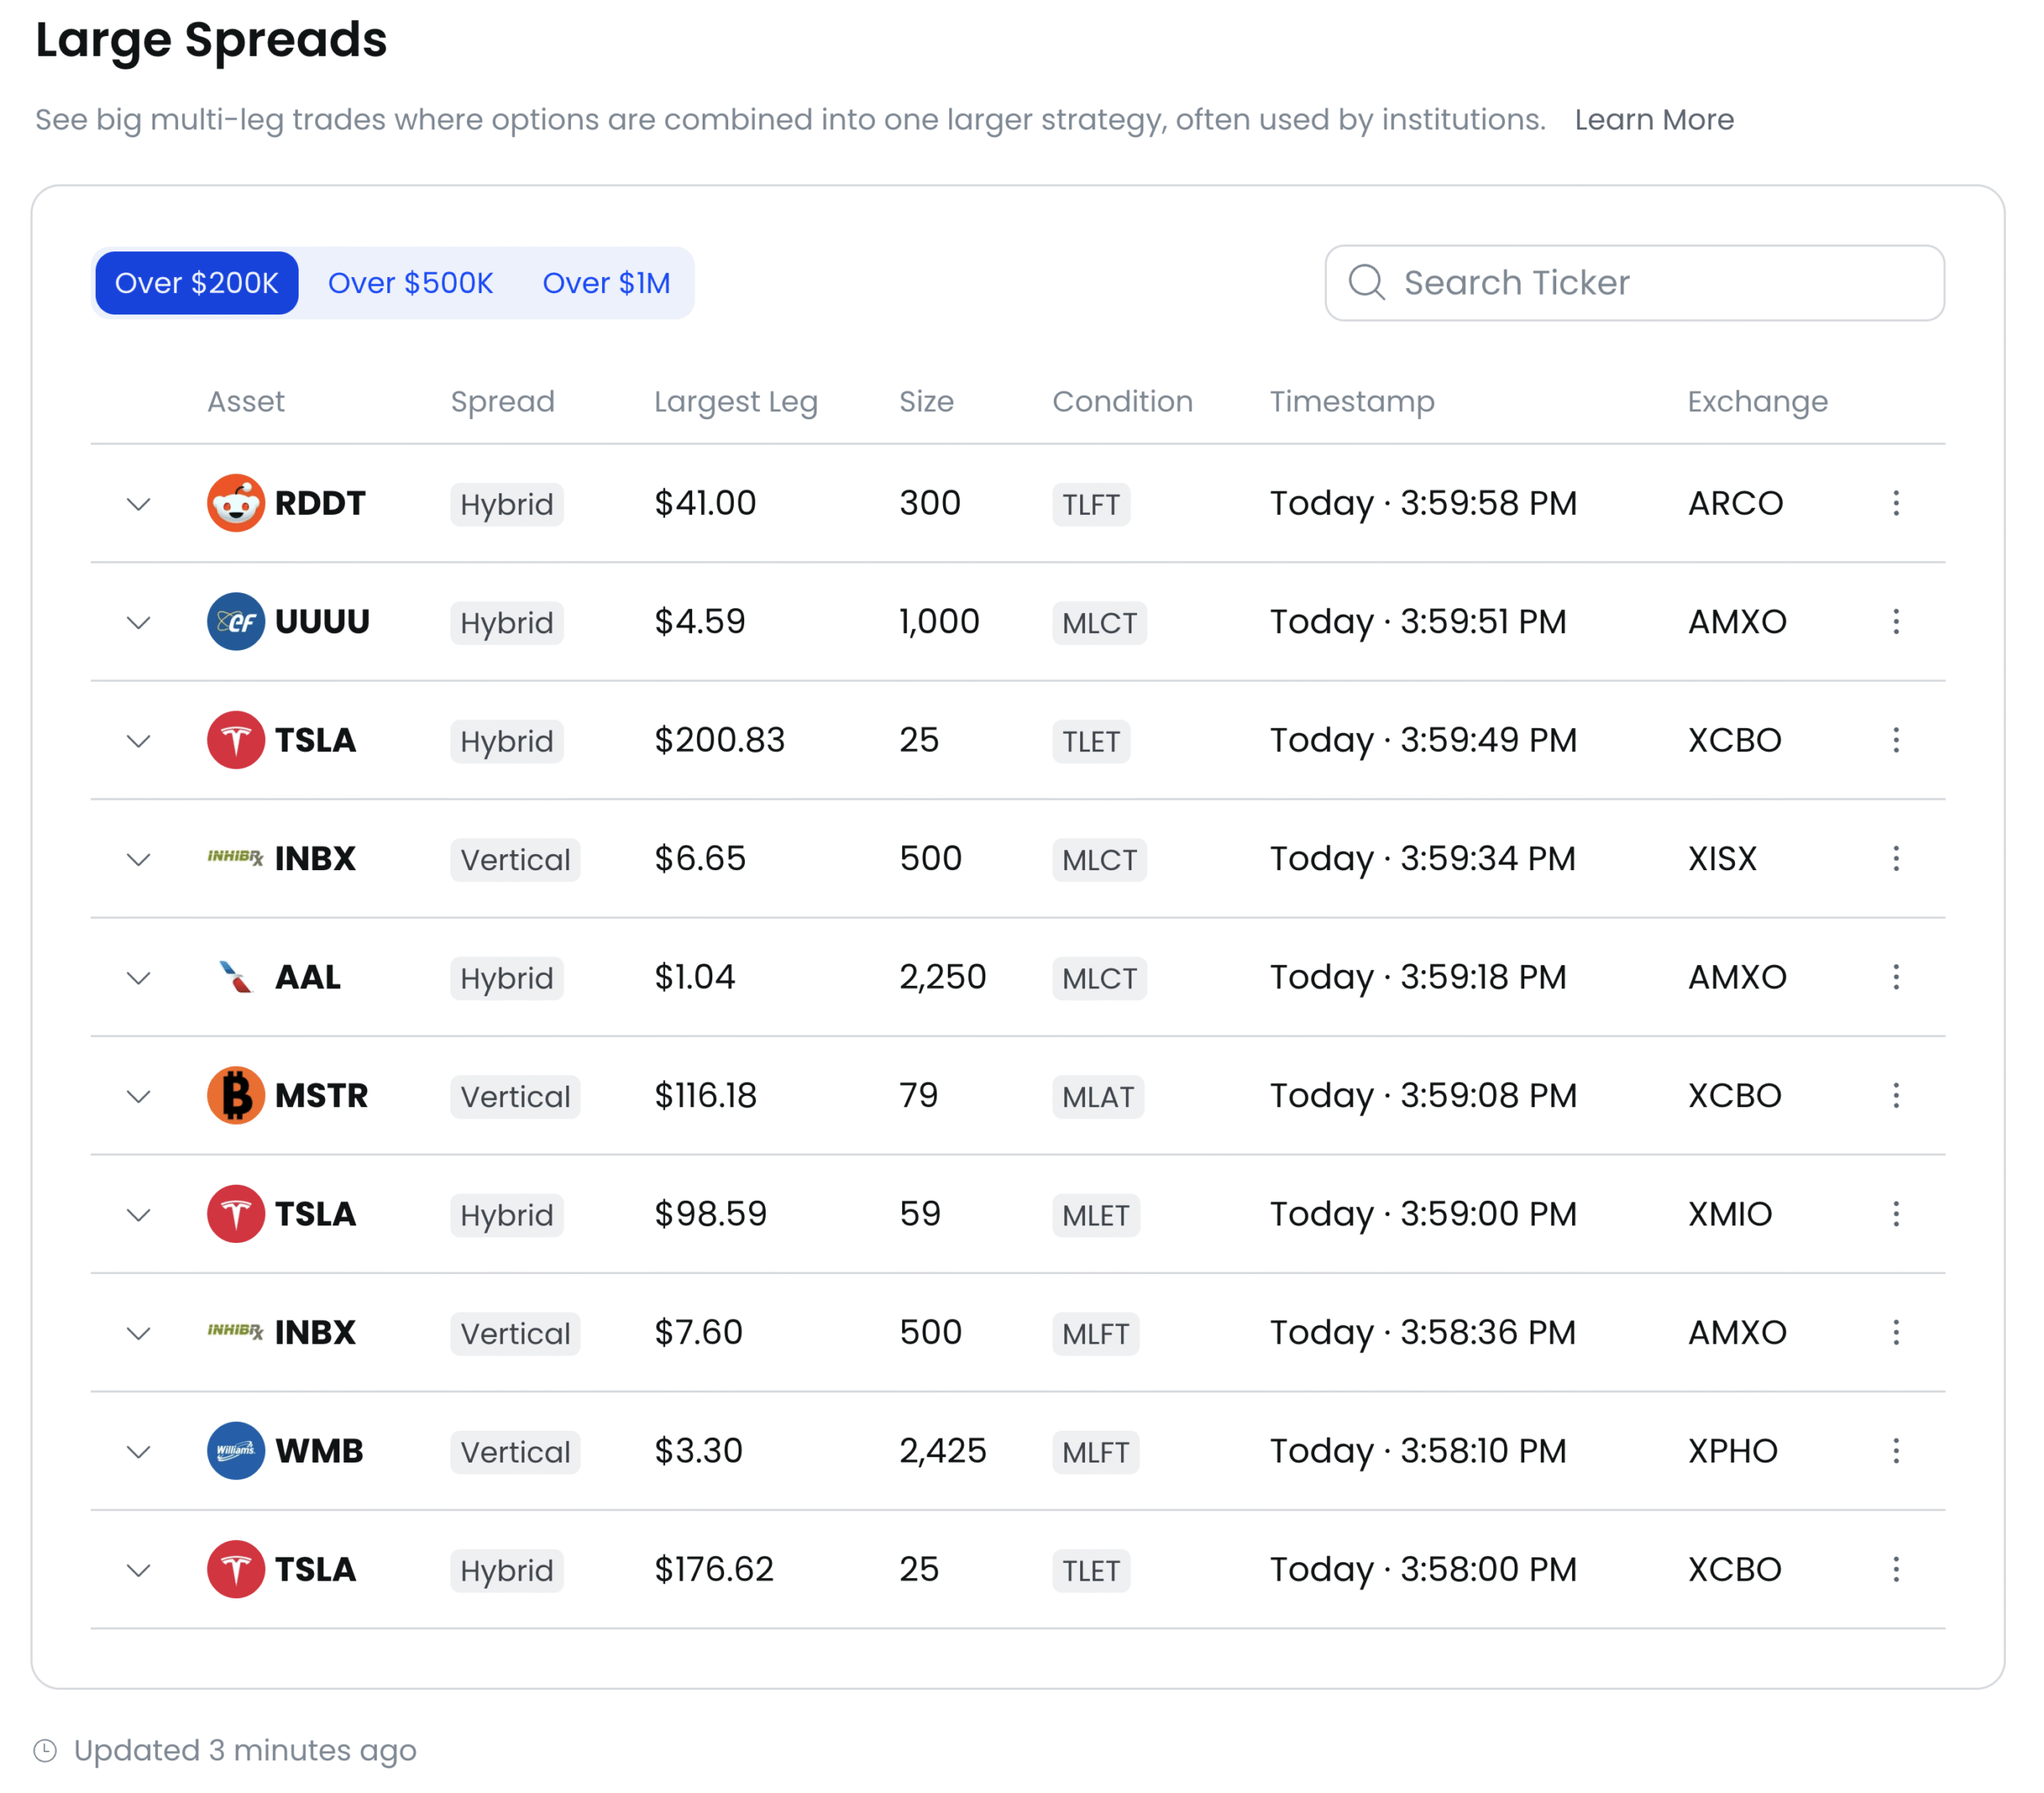
The Large Spreads feature highlights significant option spread trades. These structures are often used by advanced traders either for hedging or for speculative strategies with controlled risk. Reviewing this section can reveal strategic interest in specific assets and provide insight into institutional positioning.
You can refine the view by filtering transactions based on predefined notional thresholds:
● $200K
● $500K
● $1M+
Additionally, this section includes a search bar, allowing you to quickly look up specific tickers of interest and focus only on the spread activity most relevant to your trading.

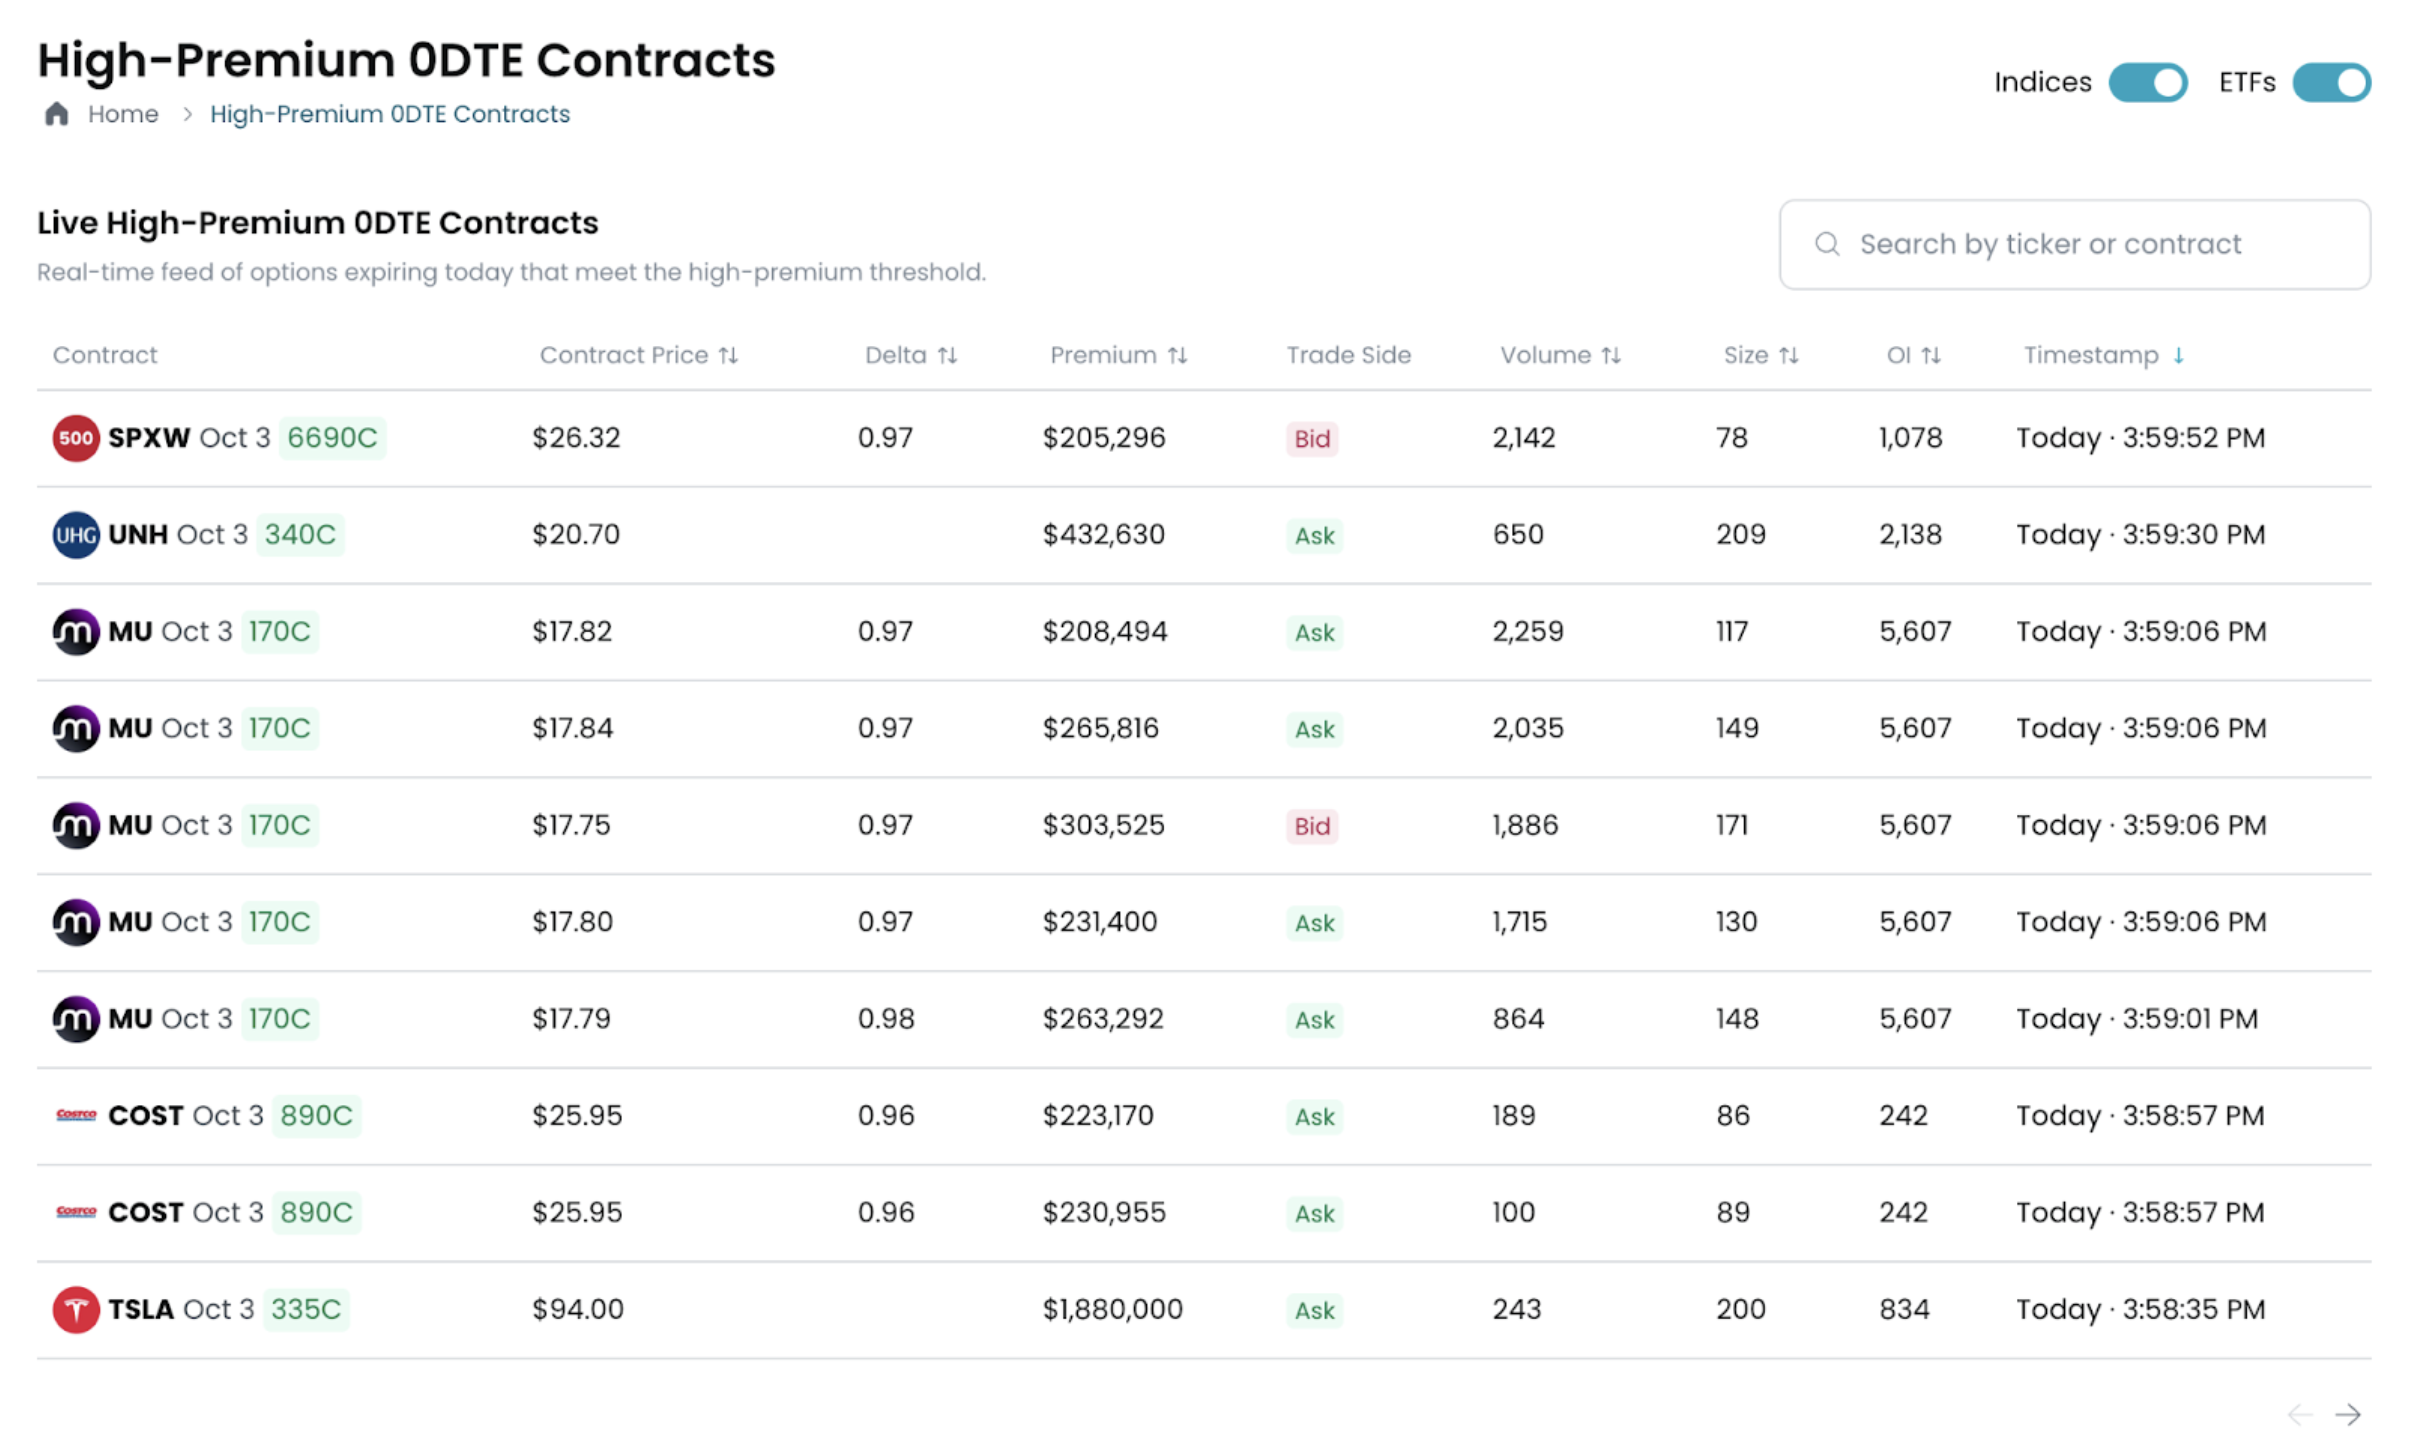
High Premium 0DTE Contracts
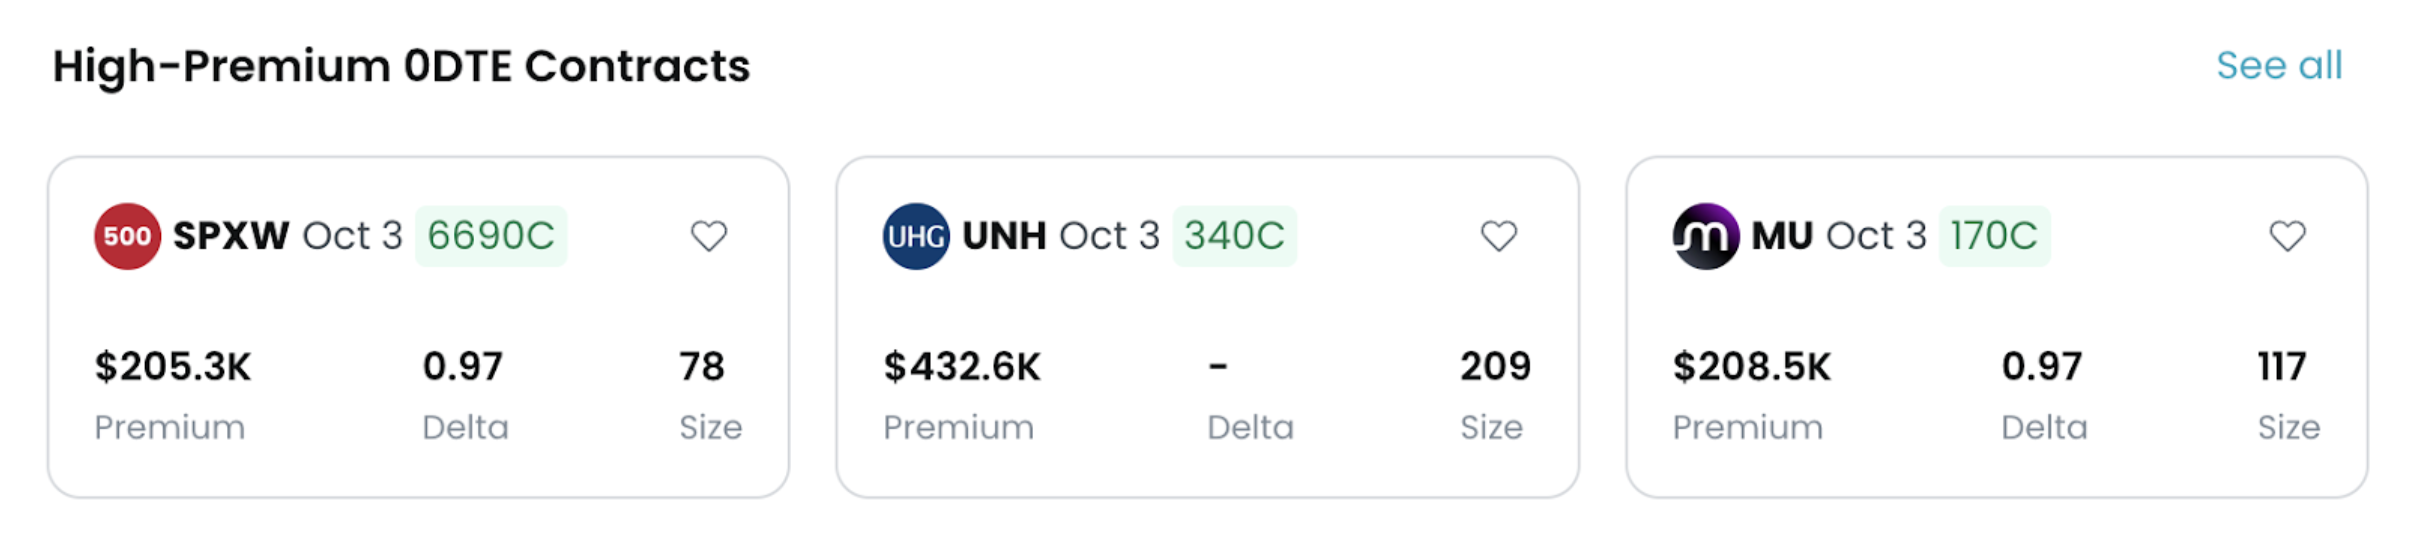
The High Premium 0DTE Contracts feature showcases option contracts with the highest premiums that expire the same day (0 Days to Expiration). These ultra short-term instruments are frequently used for aggressive speculation or immediate hedging, making them a valuable lens for spotting where high-risk intraday bets are concentrated.
As with Big Delta Trades and High Volume Session, you can click “See All” to explore the complete list of contracts. This section also includes a search bar, enabling you to quickly filter and locate specific tickers of interest within the day’s high-premium 0DTE activity.
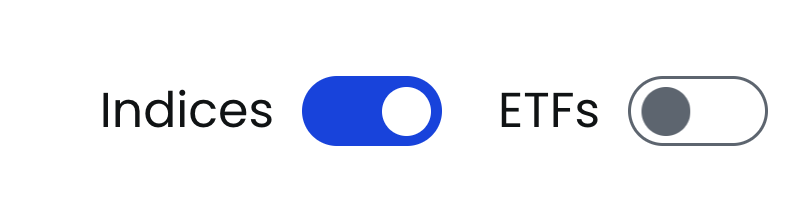
Index & ETF Toggle Filters

The platform includes Index and ETF toggle buttons that can be switched on or off for almost any filter. Since these instruments often show constant trading activity—driven in part by retirement funds and other large players—this filter helps remove the “background noise.”
By turning the toggle on, you include Index and ETF activity in the data view. Switching it off lets you isolate individual names and see the data with greater clarity, making it easier to spot unusual or directional activity.

Sidebar Panel – Icon Guide

1. Home
The Home button takes you back to the main Dashboard from anywhere in the app. Use it to return quickly to the overall market view, including sentiment, flows, and watchlists, updated in real time.
2. Modules / Scans
The Modules / Scans section gives you access to specialized analysis views and exploration tools (e.g., FlowFit, spreads, volume activity). Navigate here whenever you want to dive deeper into signals or apply filters to identify specific opportunities.
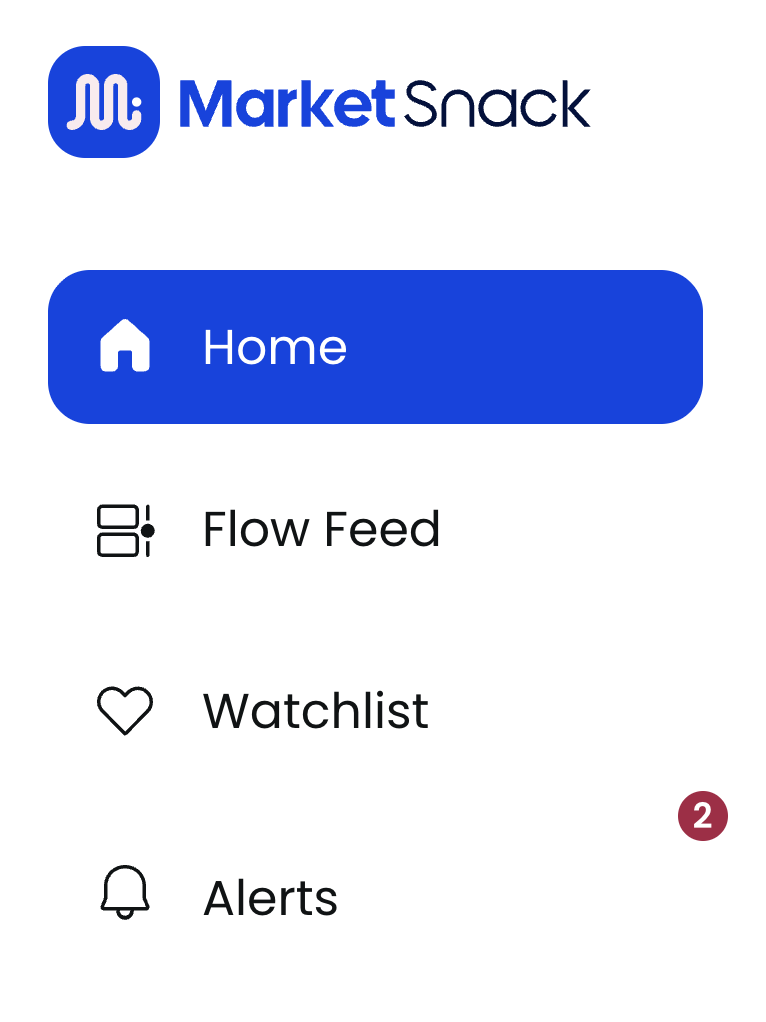
3. Watchlist (Favorites)
The Watchlist centralizes the symbols you want to monitor. Add or remove assets to track their performance and access detailed information with a single click. This helps you keep your key names organized and within easy reach.
4. Alerts / Notifications
The Alerts / Notifications panel displays important updates, such as new alerts, changes in market conditions, or system messages. A red dot signals unread items; click to review them and mark as addressed.
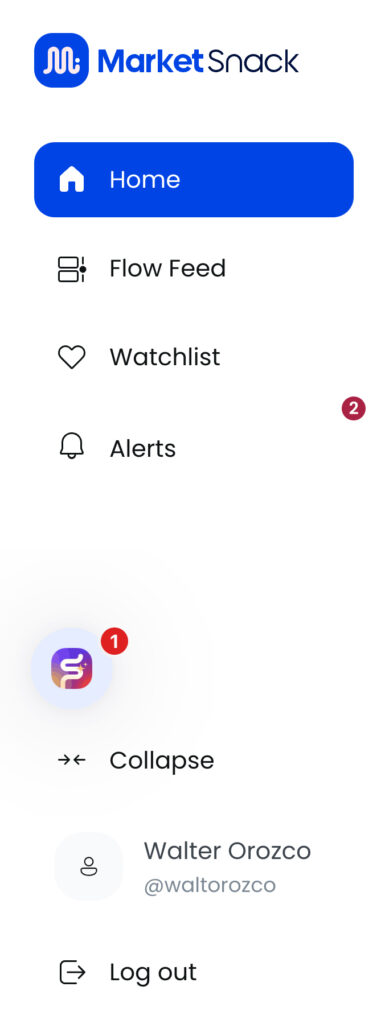
Bottom Sidebar Panel
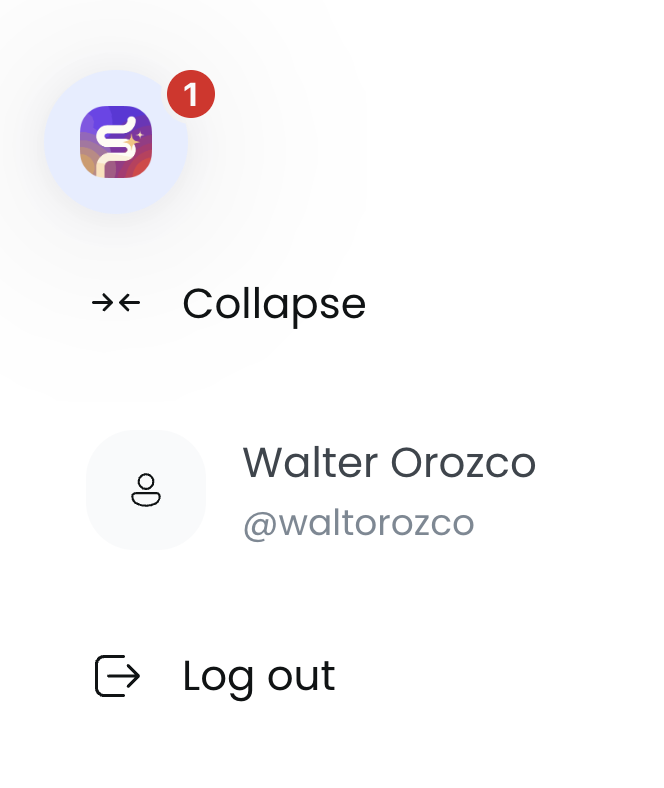
1. Snackbot (Support)
The Snackbot opens the in-app support chat within MarketSnack. From here you can start a conversation, open a ticket, and check the status of your support requests.
2. Expand / Collapse Sidebar
This control hides or shows the sidebar to maximize workspace. It is especially useful on smaller screens or when you need to view more columns.
3. User Profile / Account
The Profile section gives you access to your account details, settings, and preferences. Use it to update basic information and adjust general configurations.
4. Log Out
The Log Out option safely ends your session. It is recommended when working on shared devices or at the end of your workday.
Watchlist – Step by Step
From the sidebar, click on the heart icon (Watchlist). This will open the Watchlist screen.
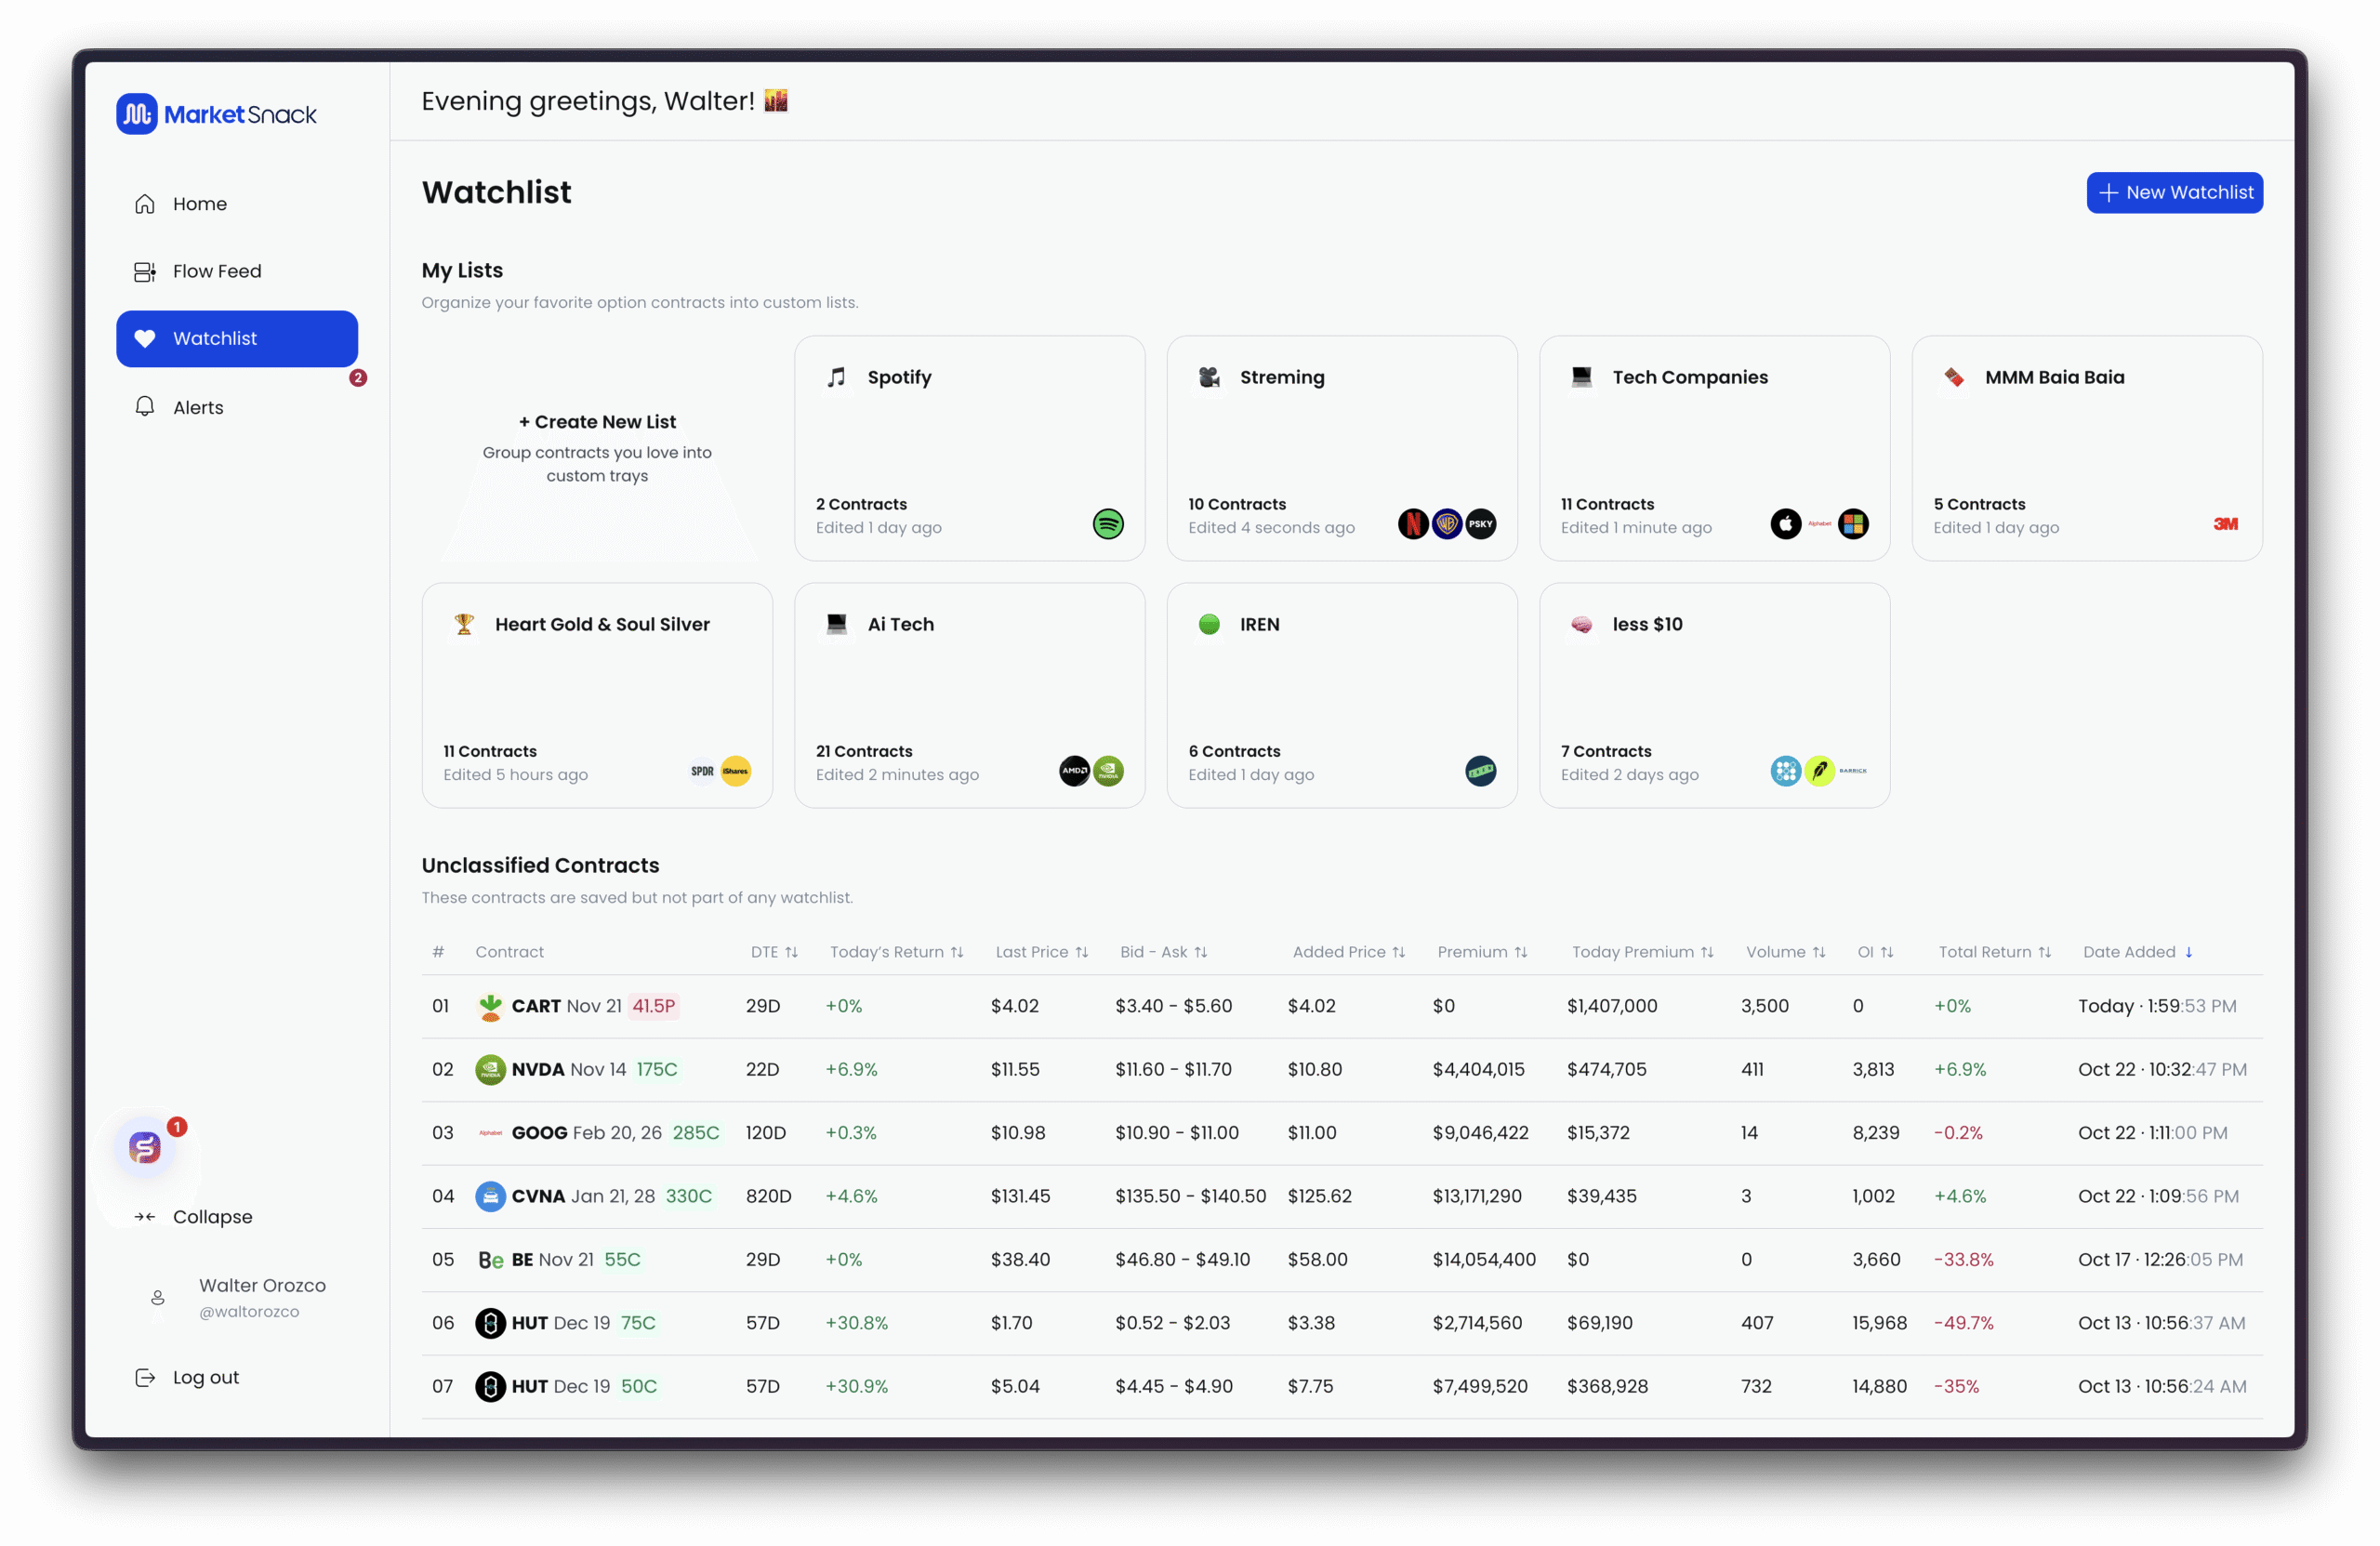
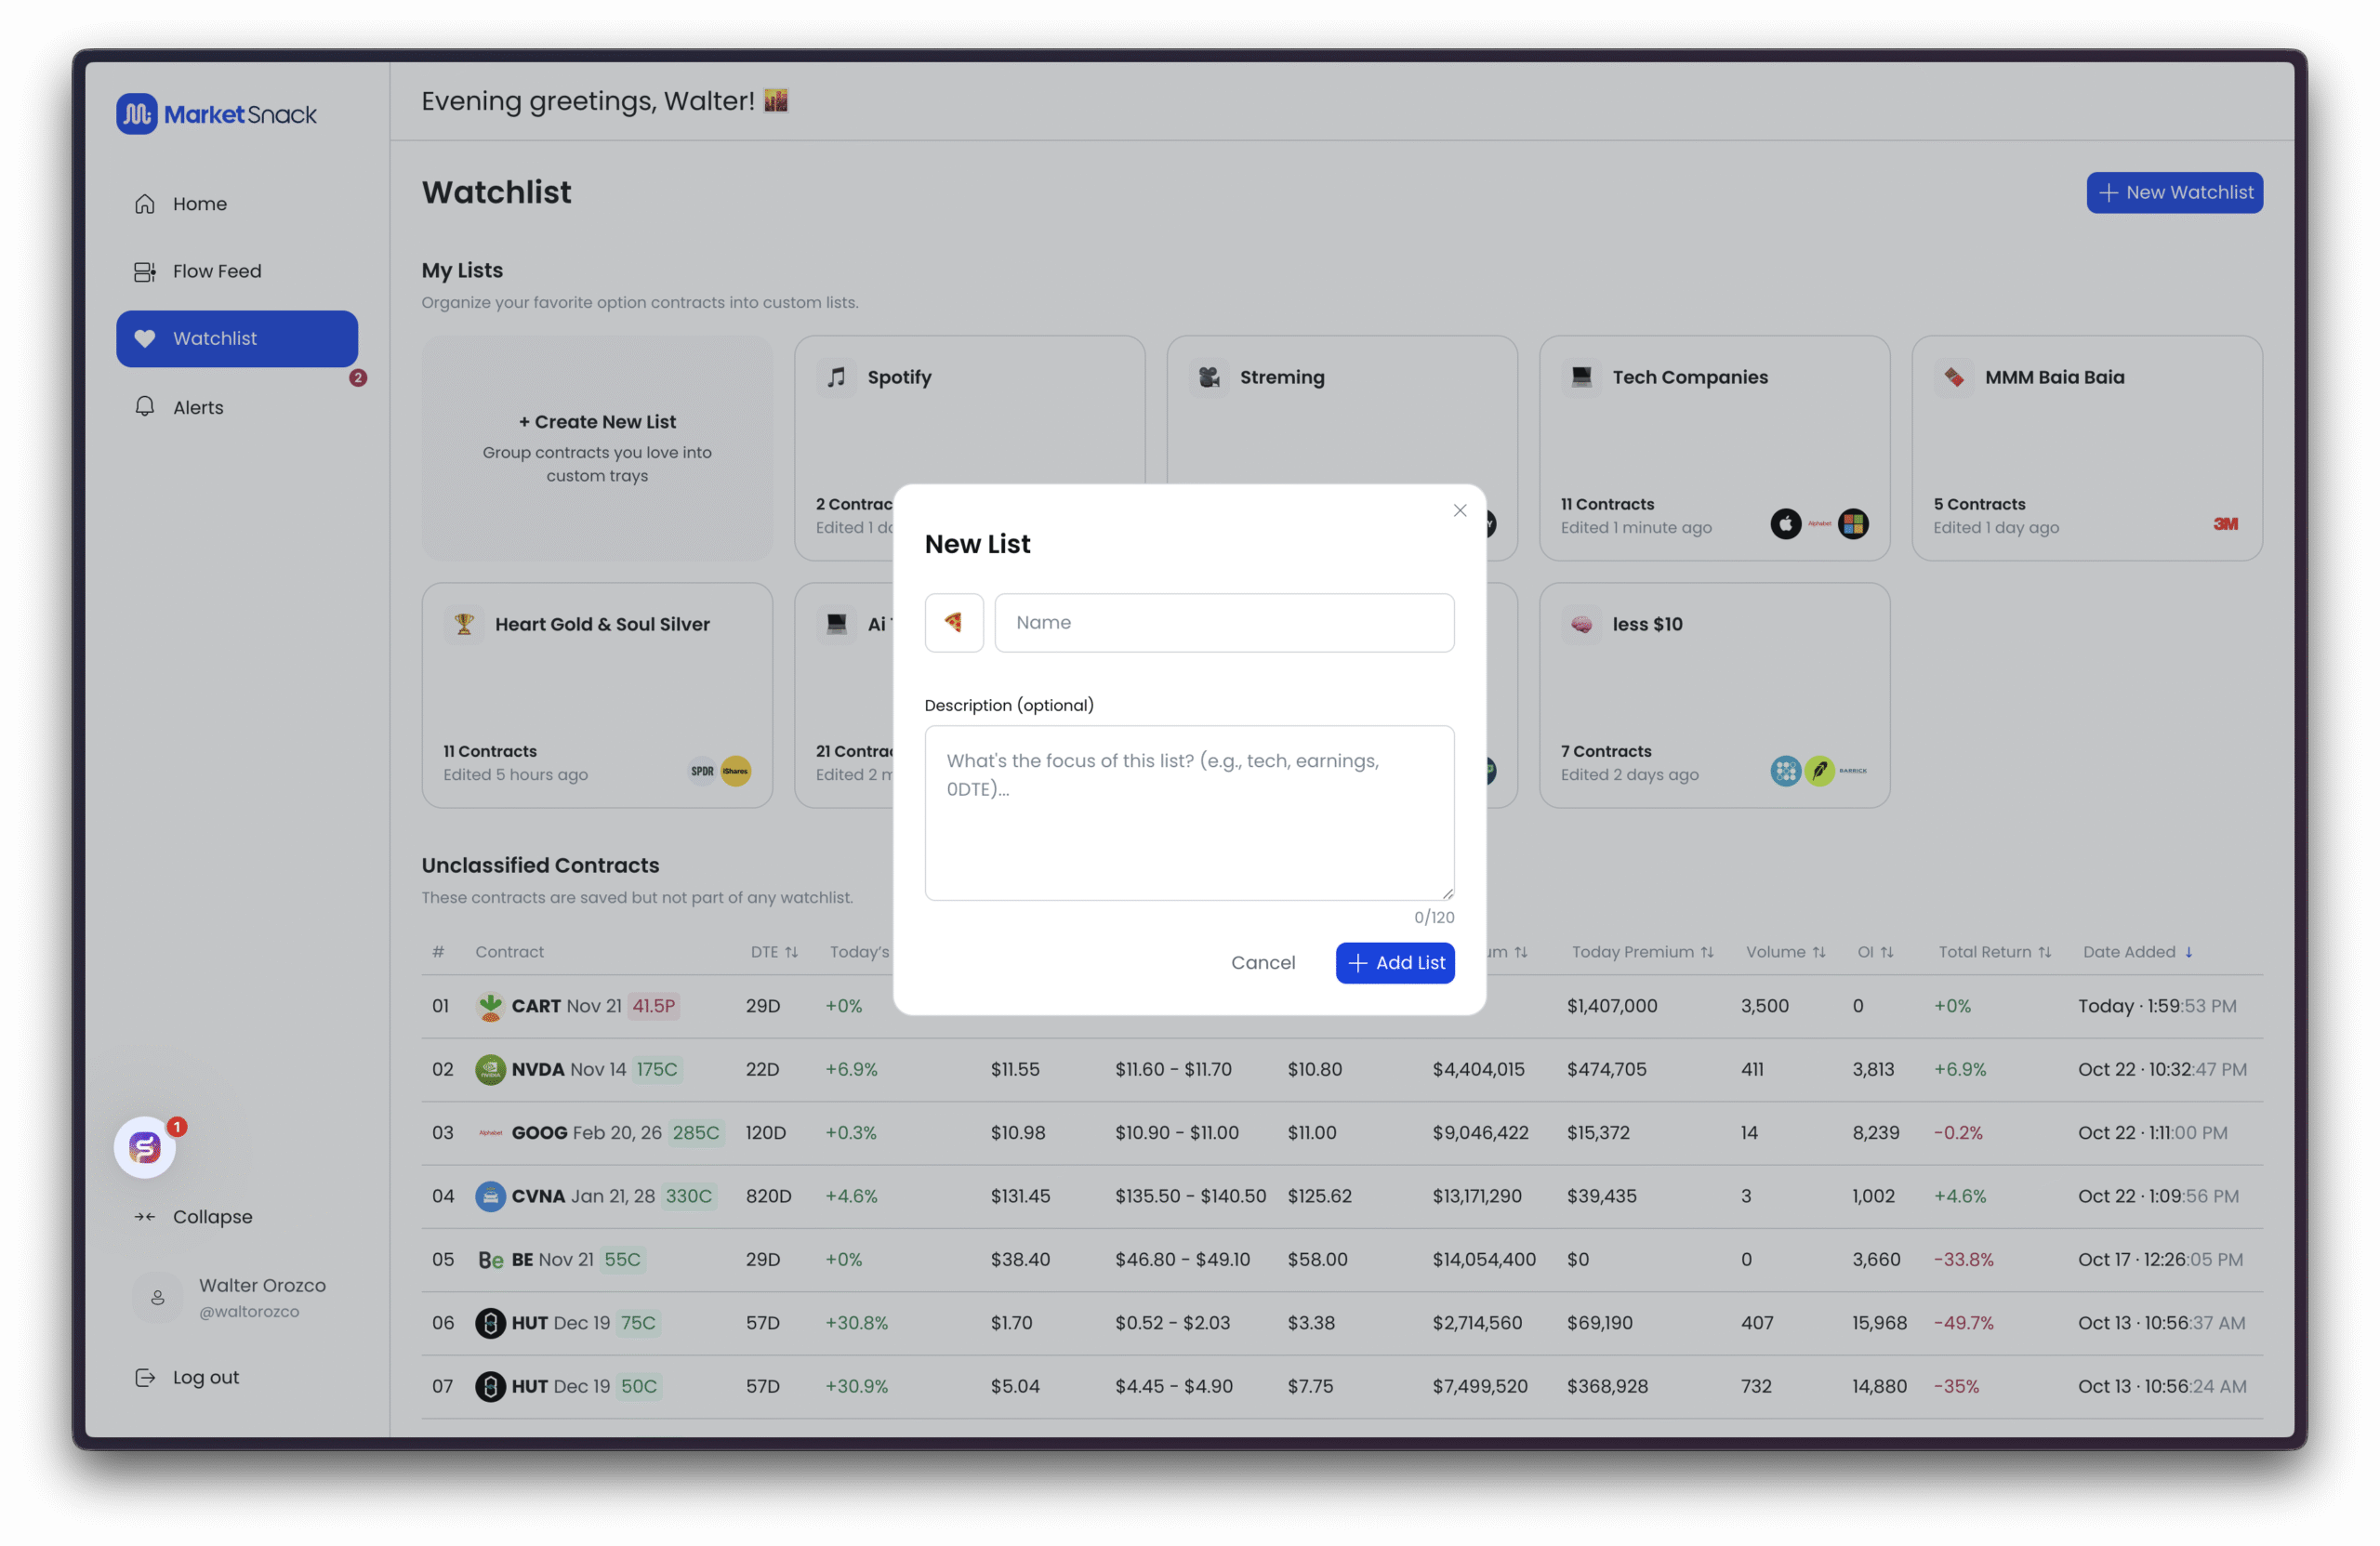
1. Create a New Watchlist
You can create a new list in two ways:
● Click the large “+ Create New List” button located just below My Lists.
● Or, click New Watchlist in the top-right corner of the screen.
Both options will open the setup screen.
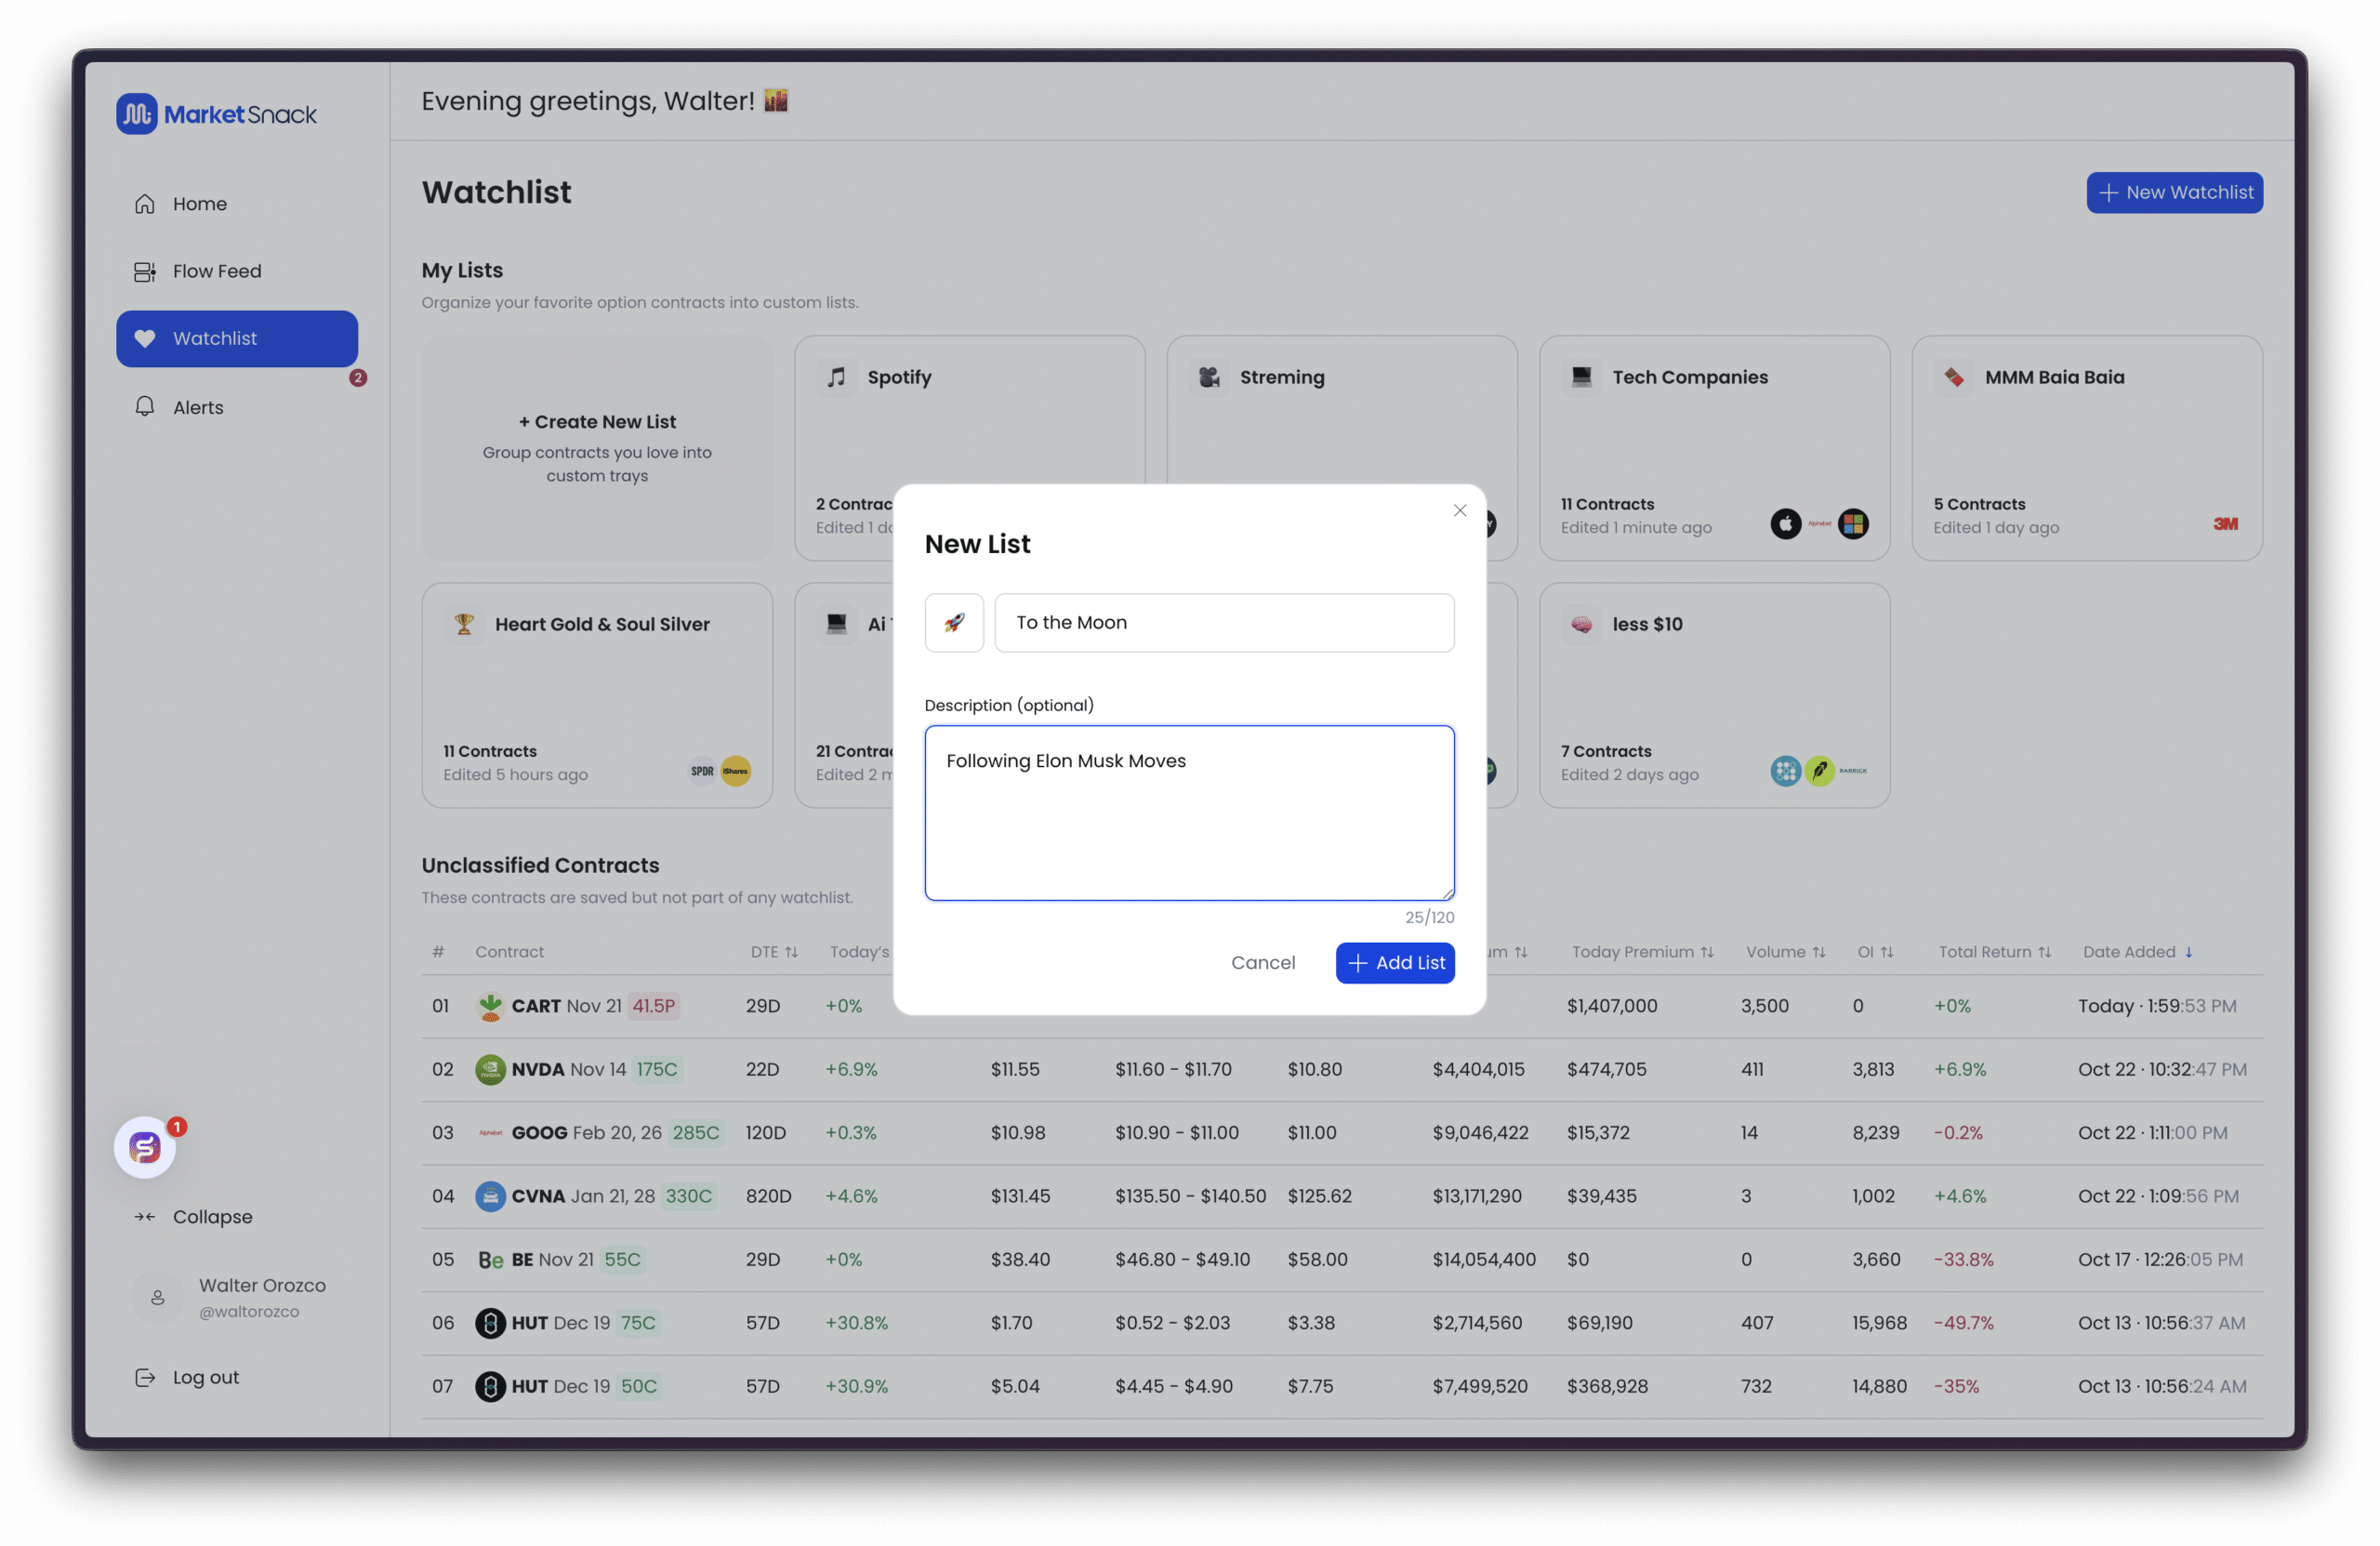
● Under Name, enter the title for your list.
● Optionally, add a short description of the contracts you plan to include.
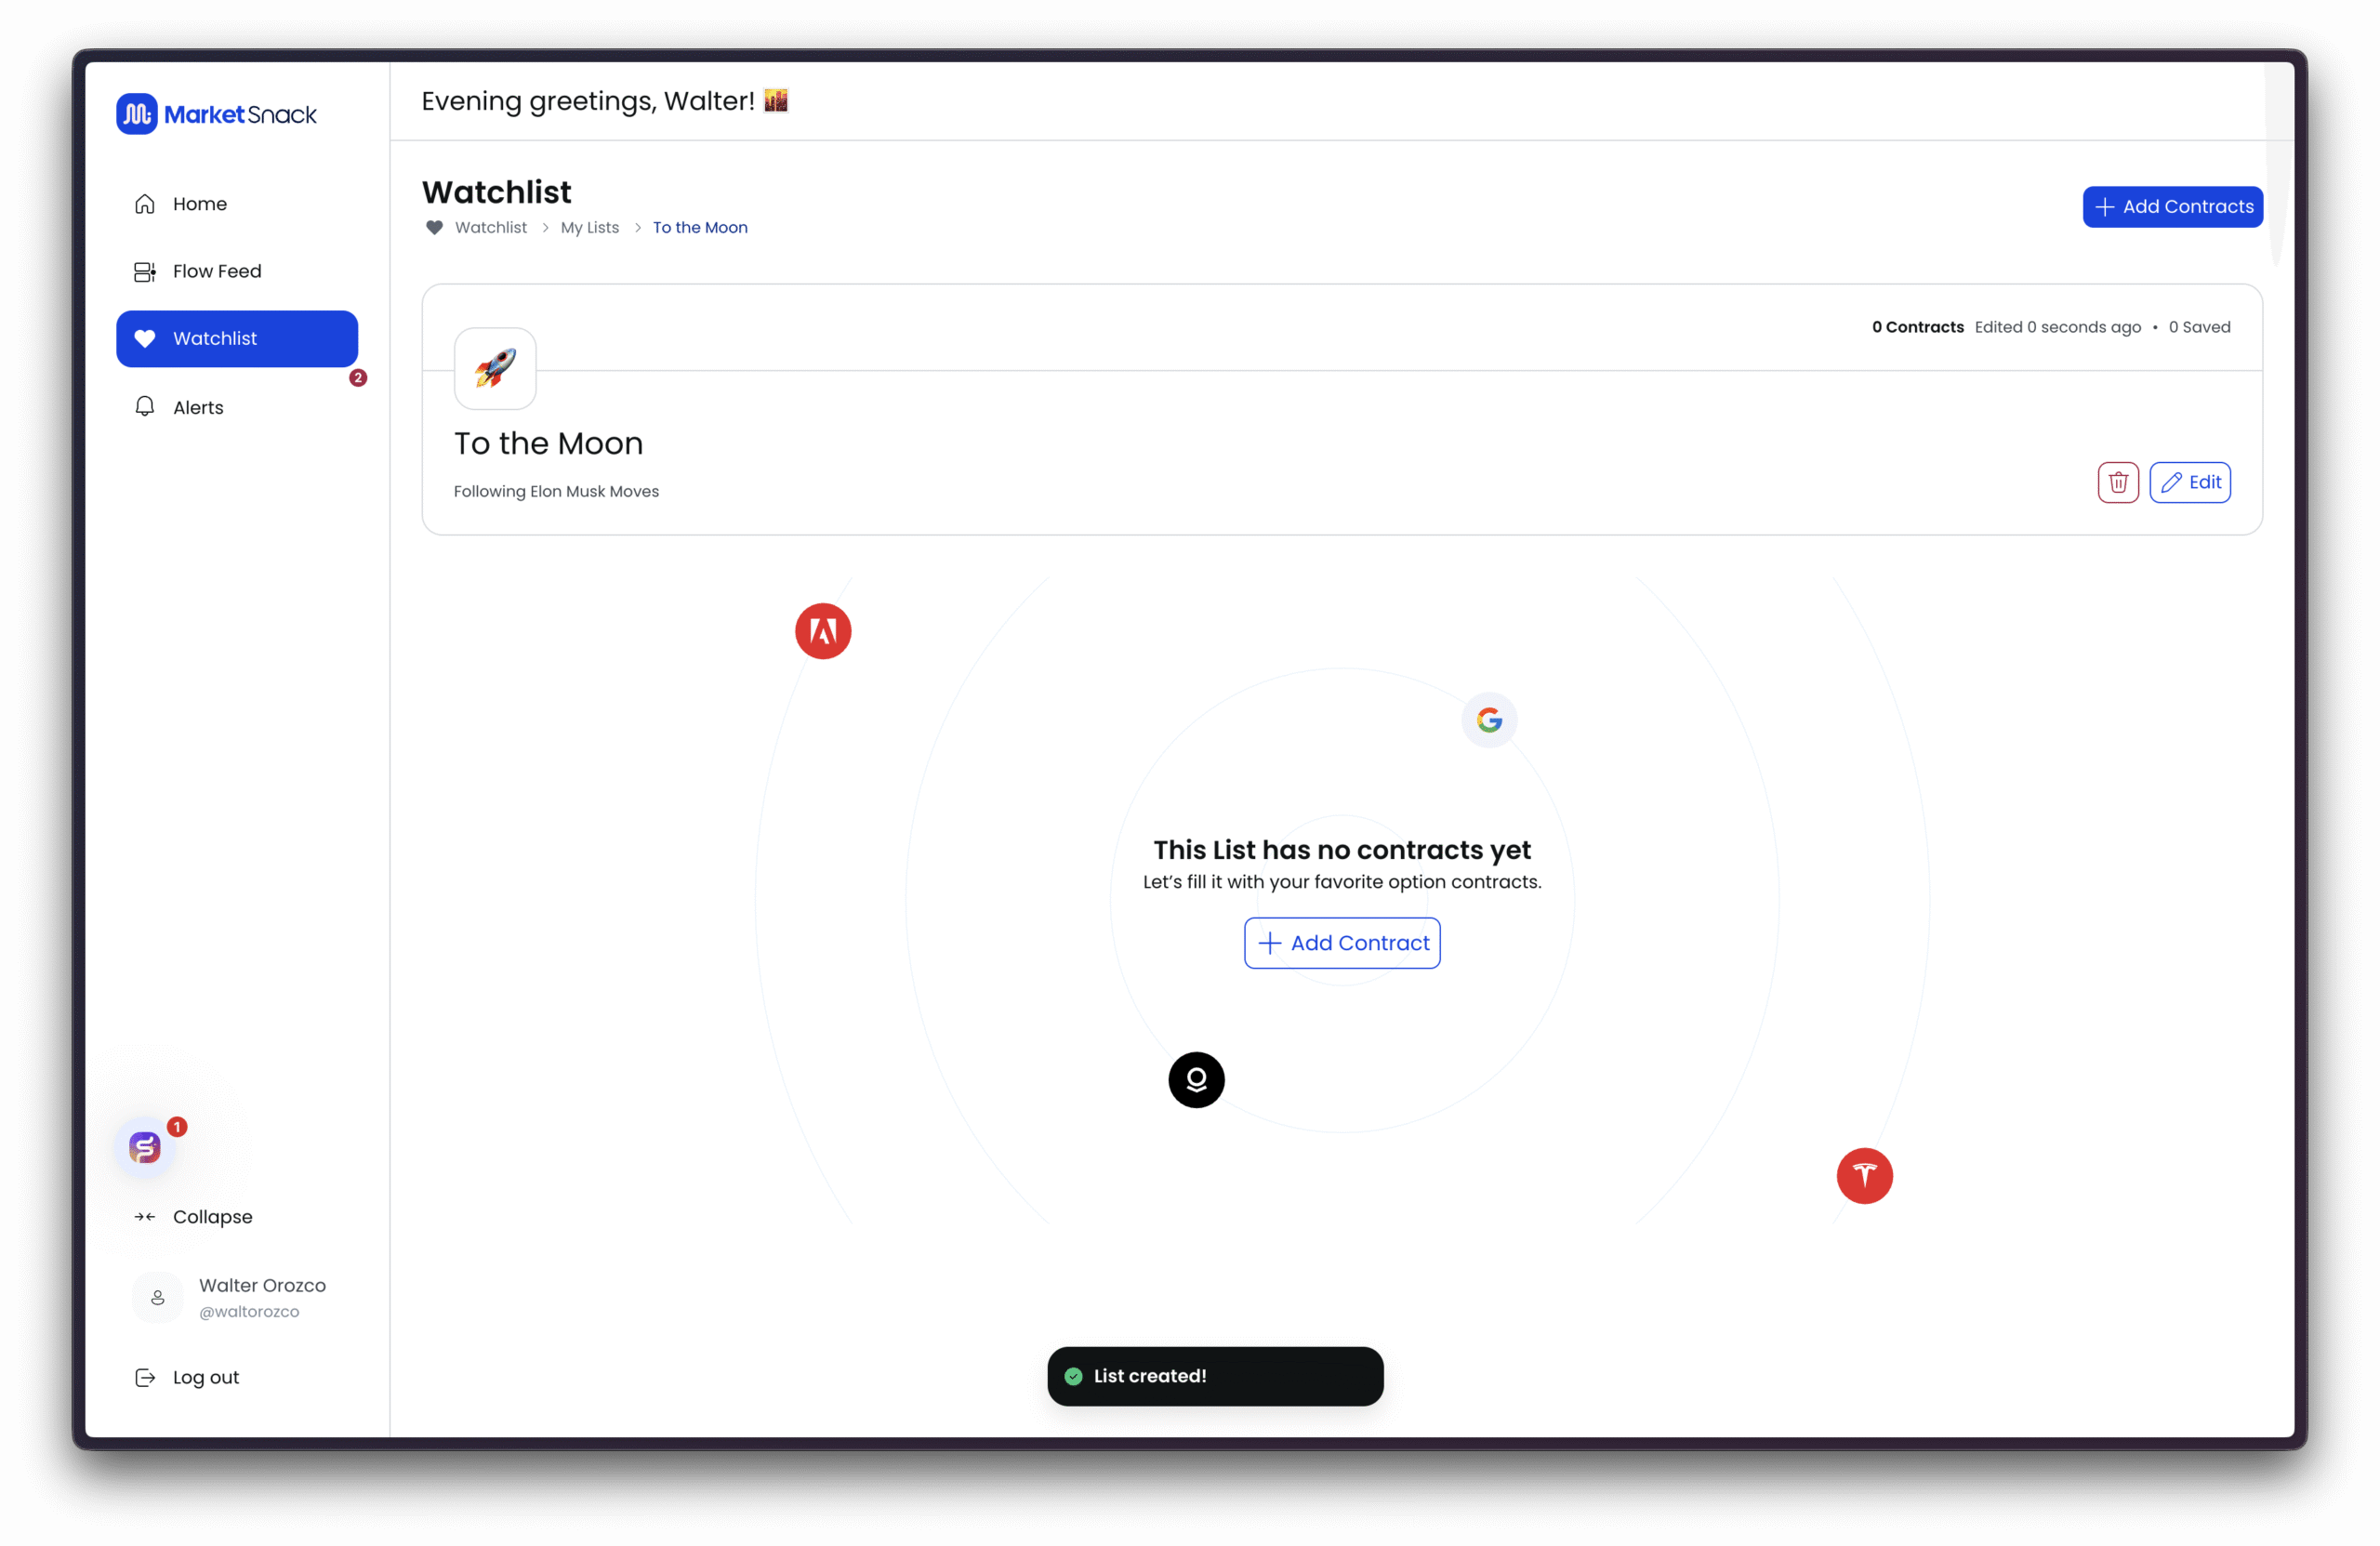
Once you click Add, your new list will be created and displayed.
2. Add Contracts to Your Watchlist
On the right-hand side, click the Add Contracts button. A search bar will appear where you can type either the stock name or the specific contract code.
3. Select a Symbol and Contract
After choosing a stock, you will see the available option chains.
● Select contracts by expiration date and strike price.
● Filter by Calls or Puts to narrow the view.
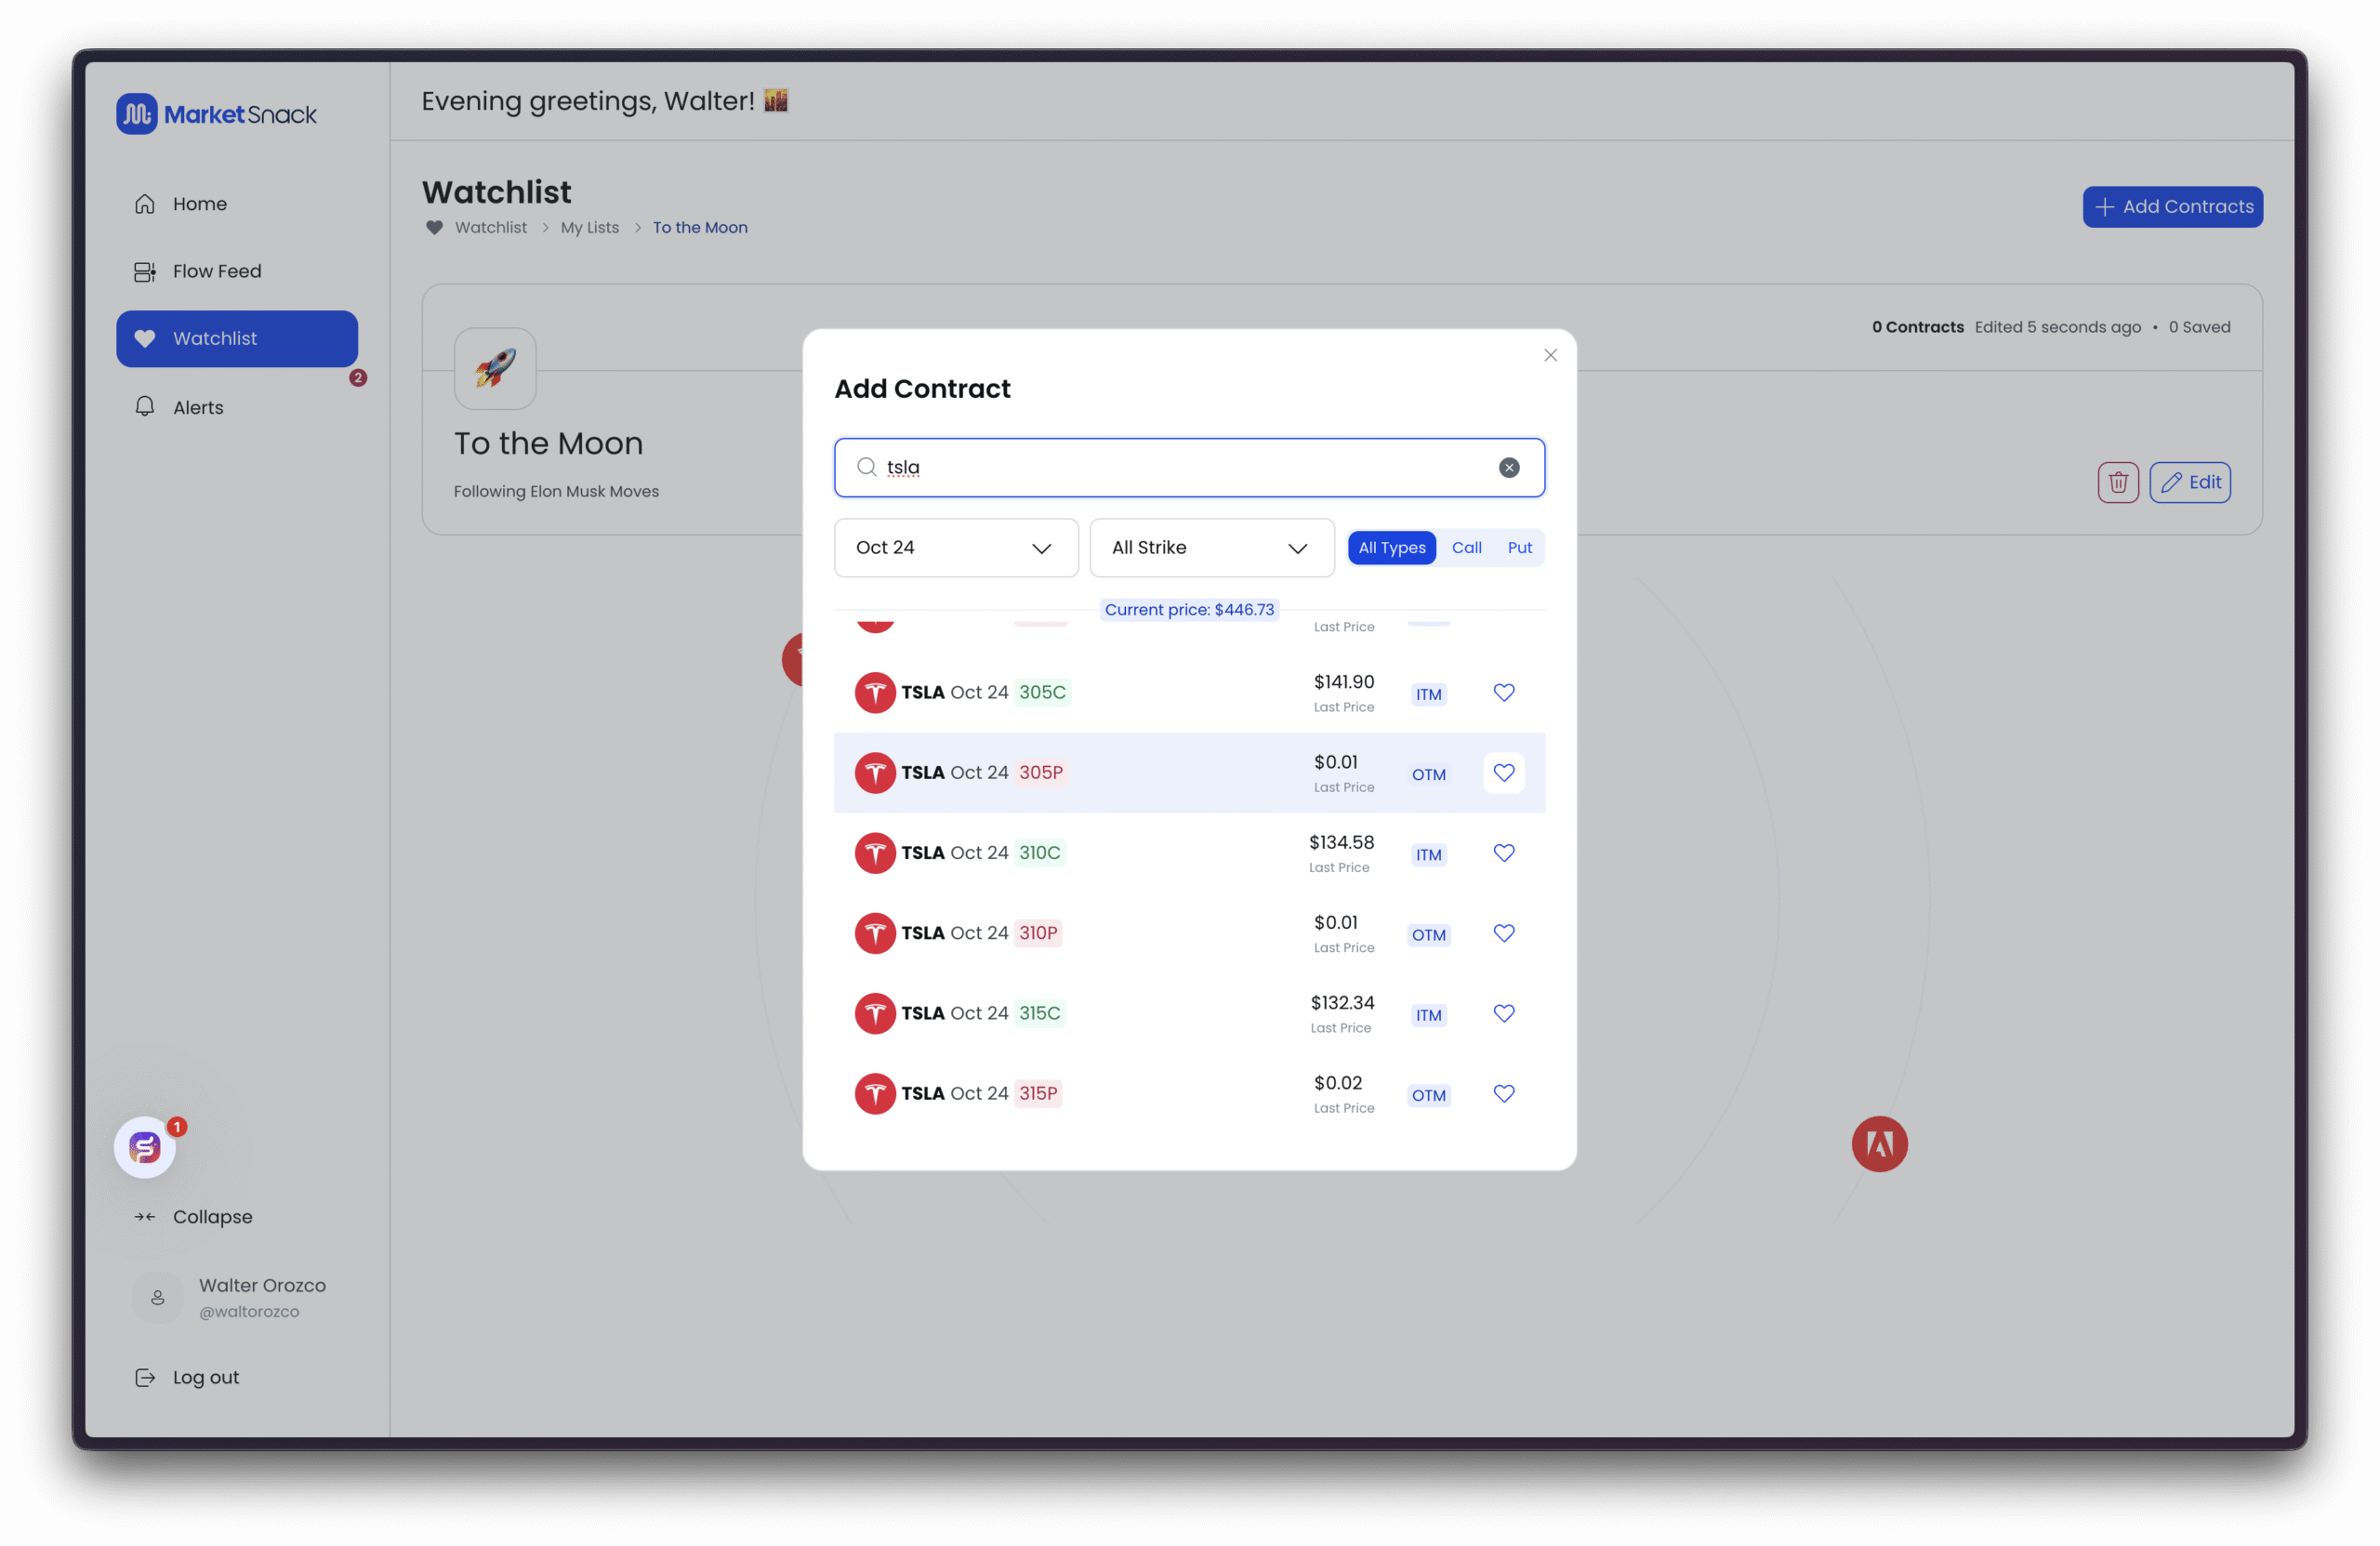
The contracts you add will then appear in your Watchlist.
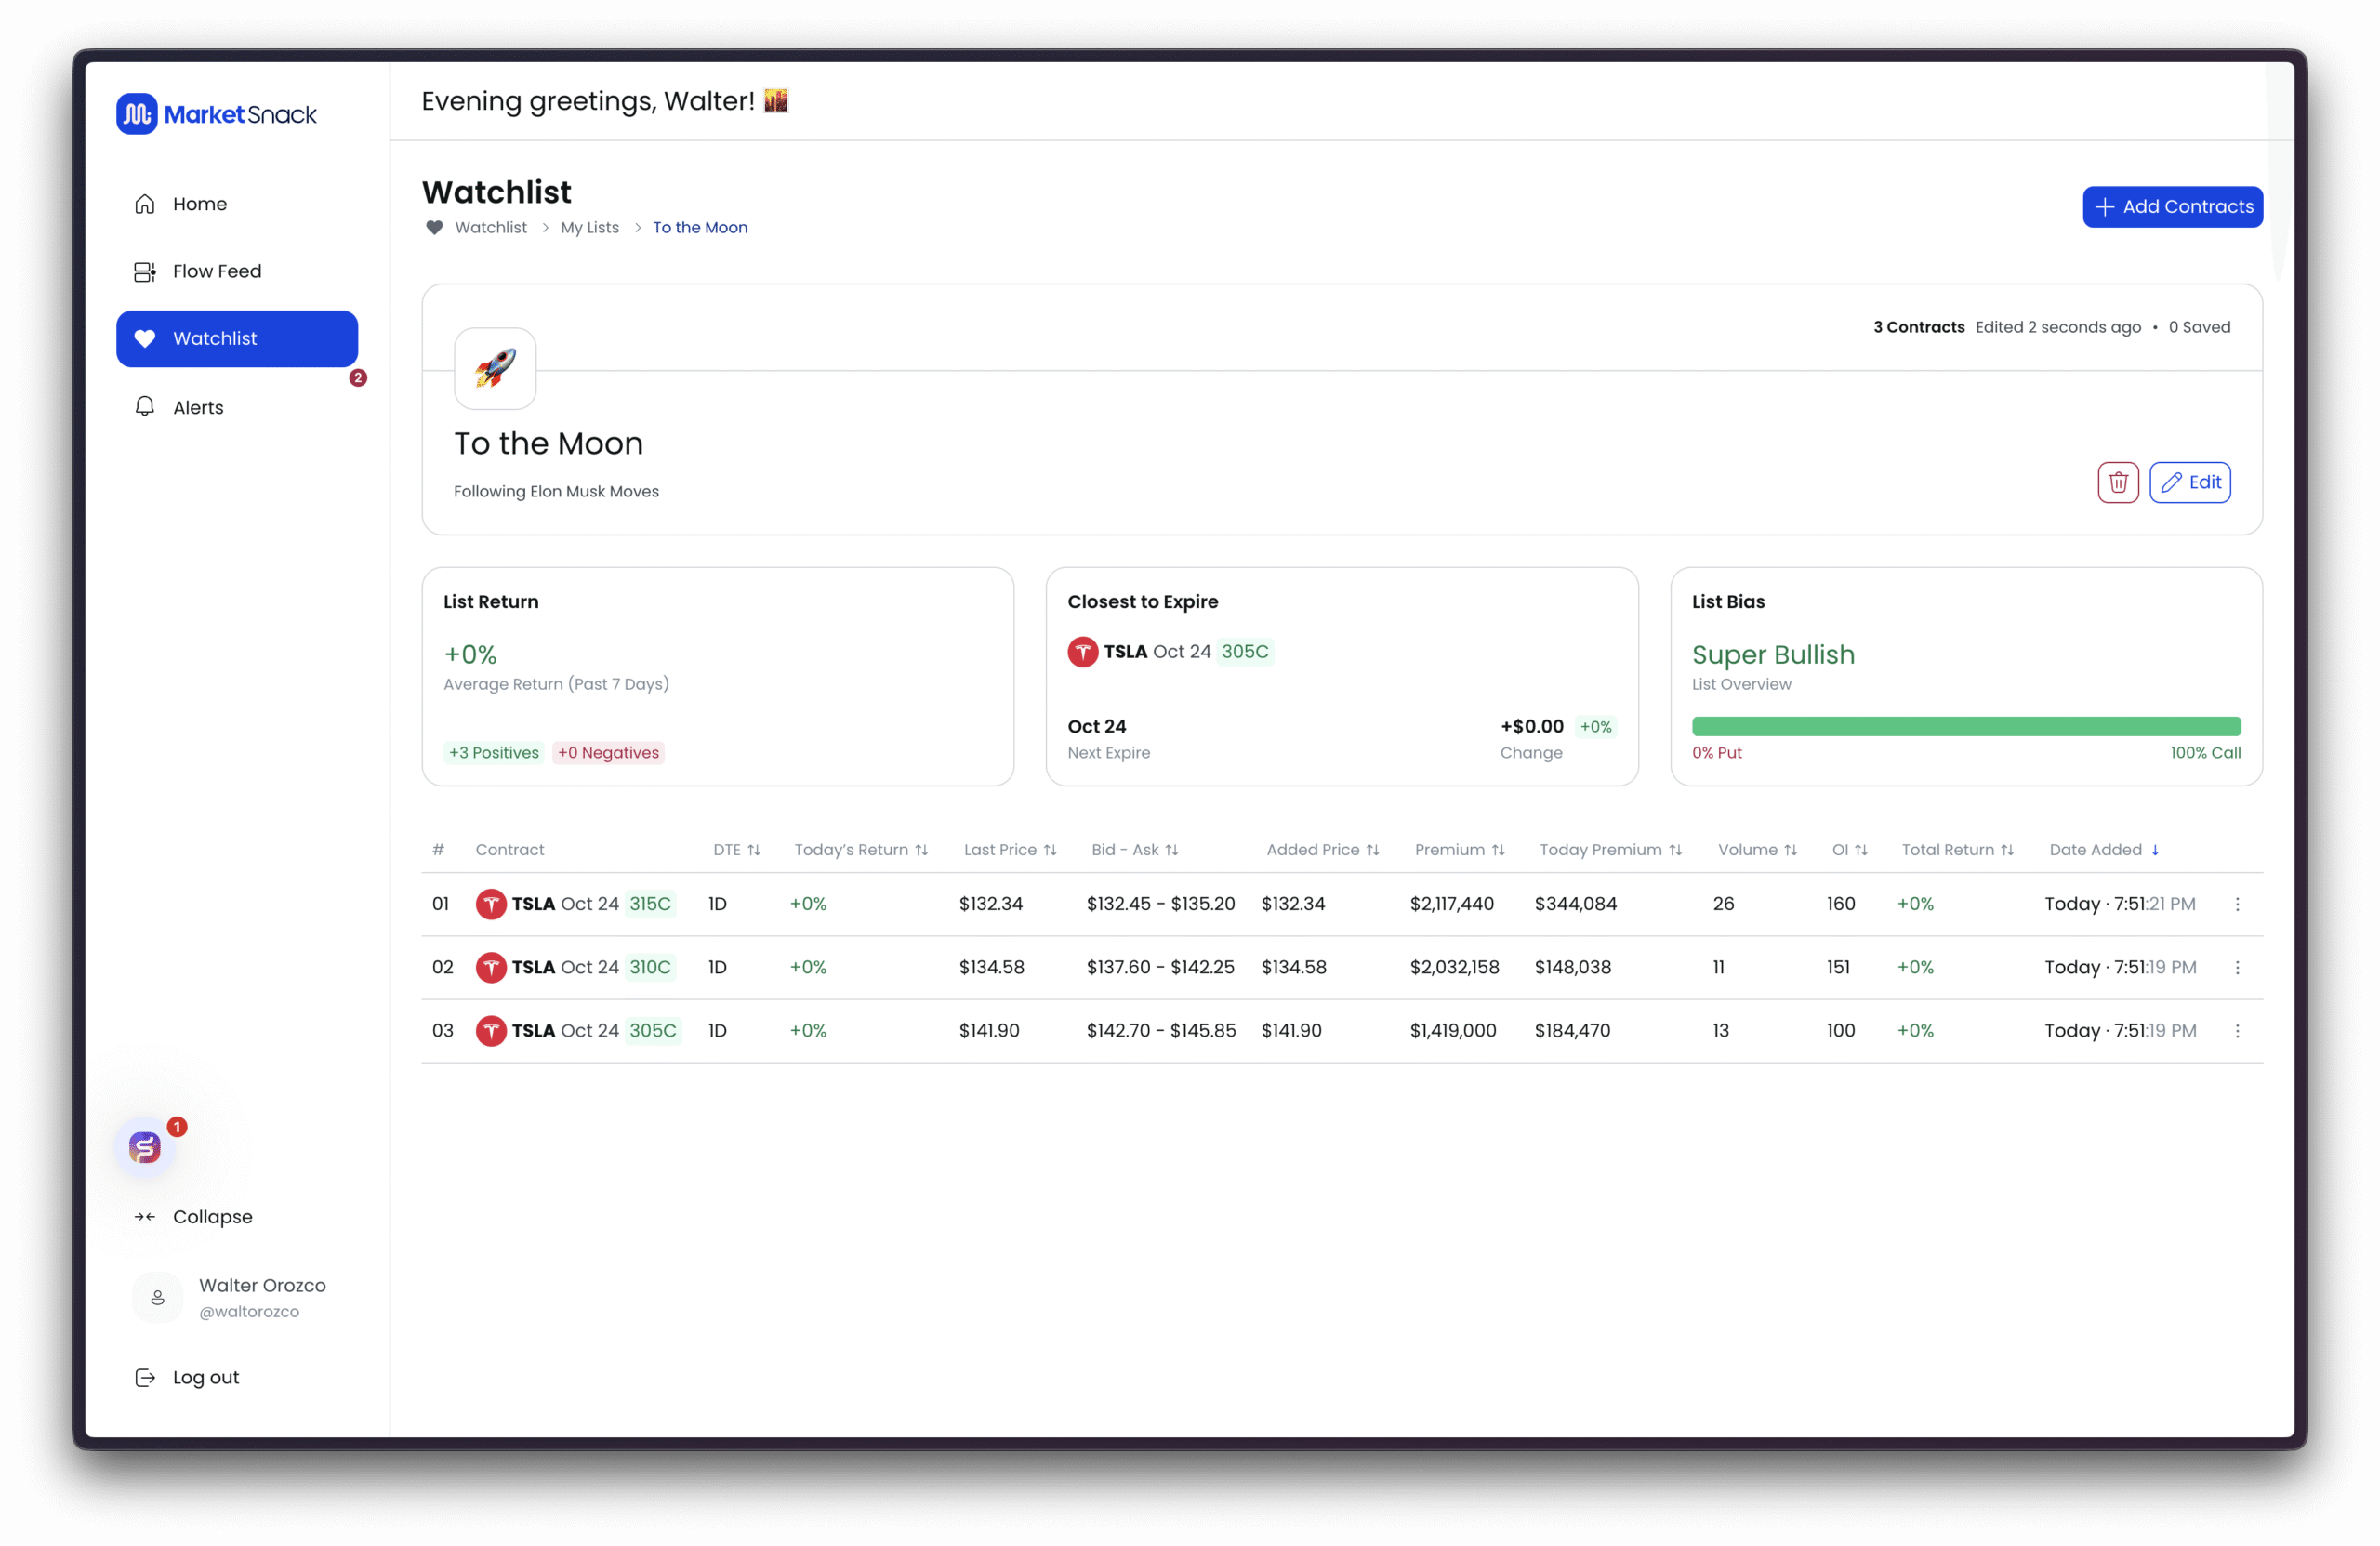
4. Monitor Contract Performance
Each contract card displays:
● The return of the contract and the overall return of the list.
● The contract closest to expiration.
● The distribution of bullish (calls) vs. bearish (puts) exposure in your Watchlist.
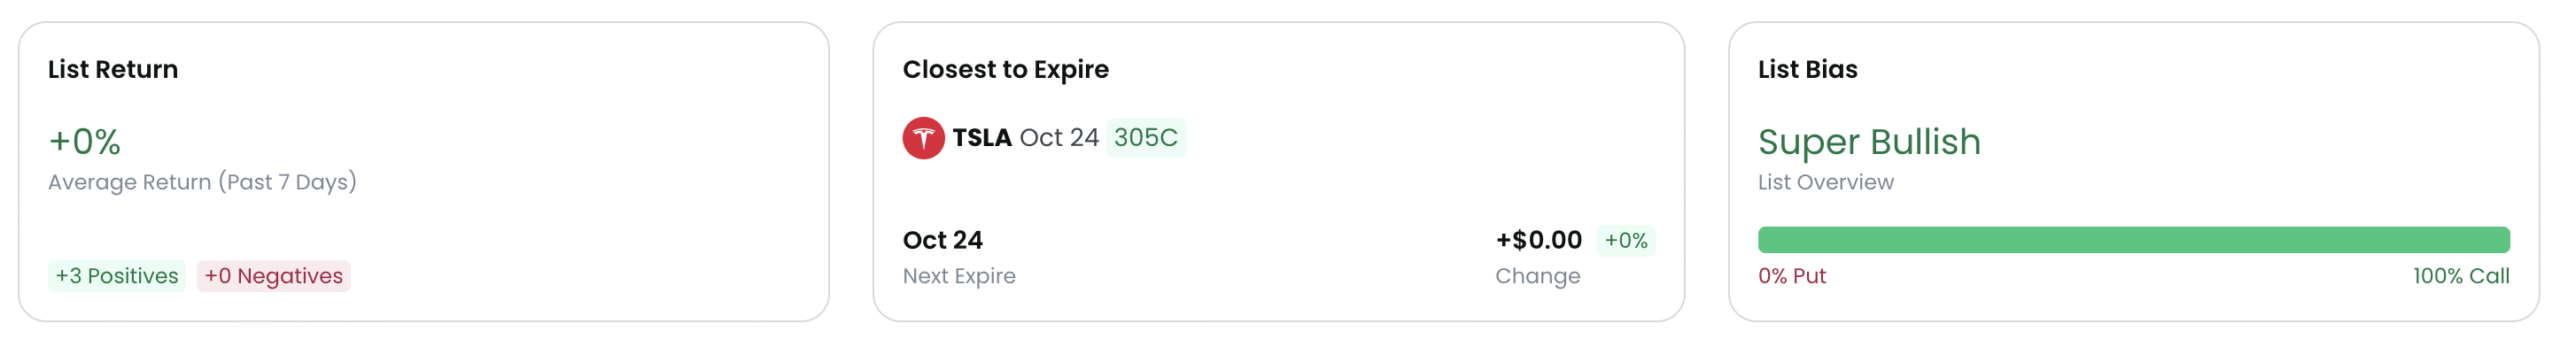
This allows you to quickly assess whether your list is positioned more toward upside or downside moves.
5. Analyze the Contract Table
The Watchlist table provides detailed metrics for every saved option:
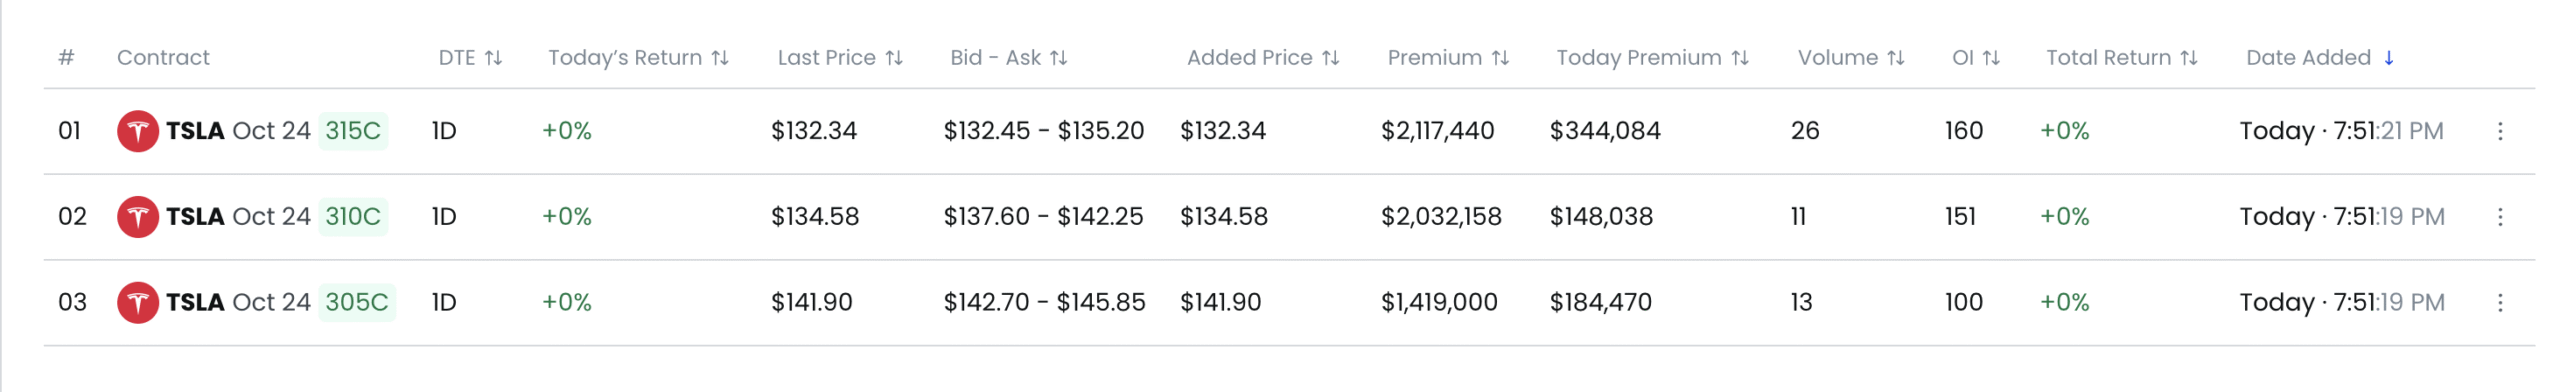
● Ticker and expiration date
● DTE (Days to Expiration)
● Today return = Daily return
● Last price
● Bid–Ask spread
● Added Price
● Premium = Total premium invested as of today
● Premium traded in the daily session
● Volume = Current volume today
● Open Interest
● Break-even percentage
● Total Return (this is the total return of the contract since added to your watchlist)
● Date and time added to watchlist
Together, these columns allow you to evaluate both short-term performance and the overall strategic relevance of each position.
6. Expired Contracts
Expired contracts remain in your Watchlist for up to 3 days after expiration, ensuring your list stays updated and organized.
Flow Feed
The Flow Feed displays the most relevant option flows and shows how price, volume, and implied volatility (IV) interact for each ticker and time period. It helps you detect trends, accumulation, divergences, and unusual spikes, providing strategic signals that support better entry and exit decisions with added context.
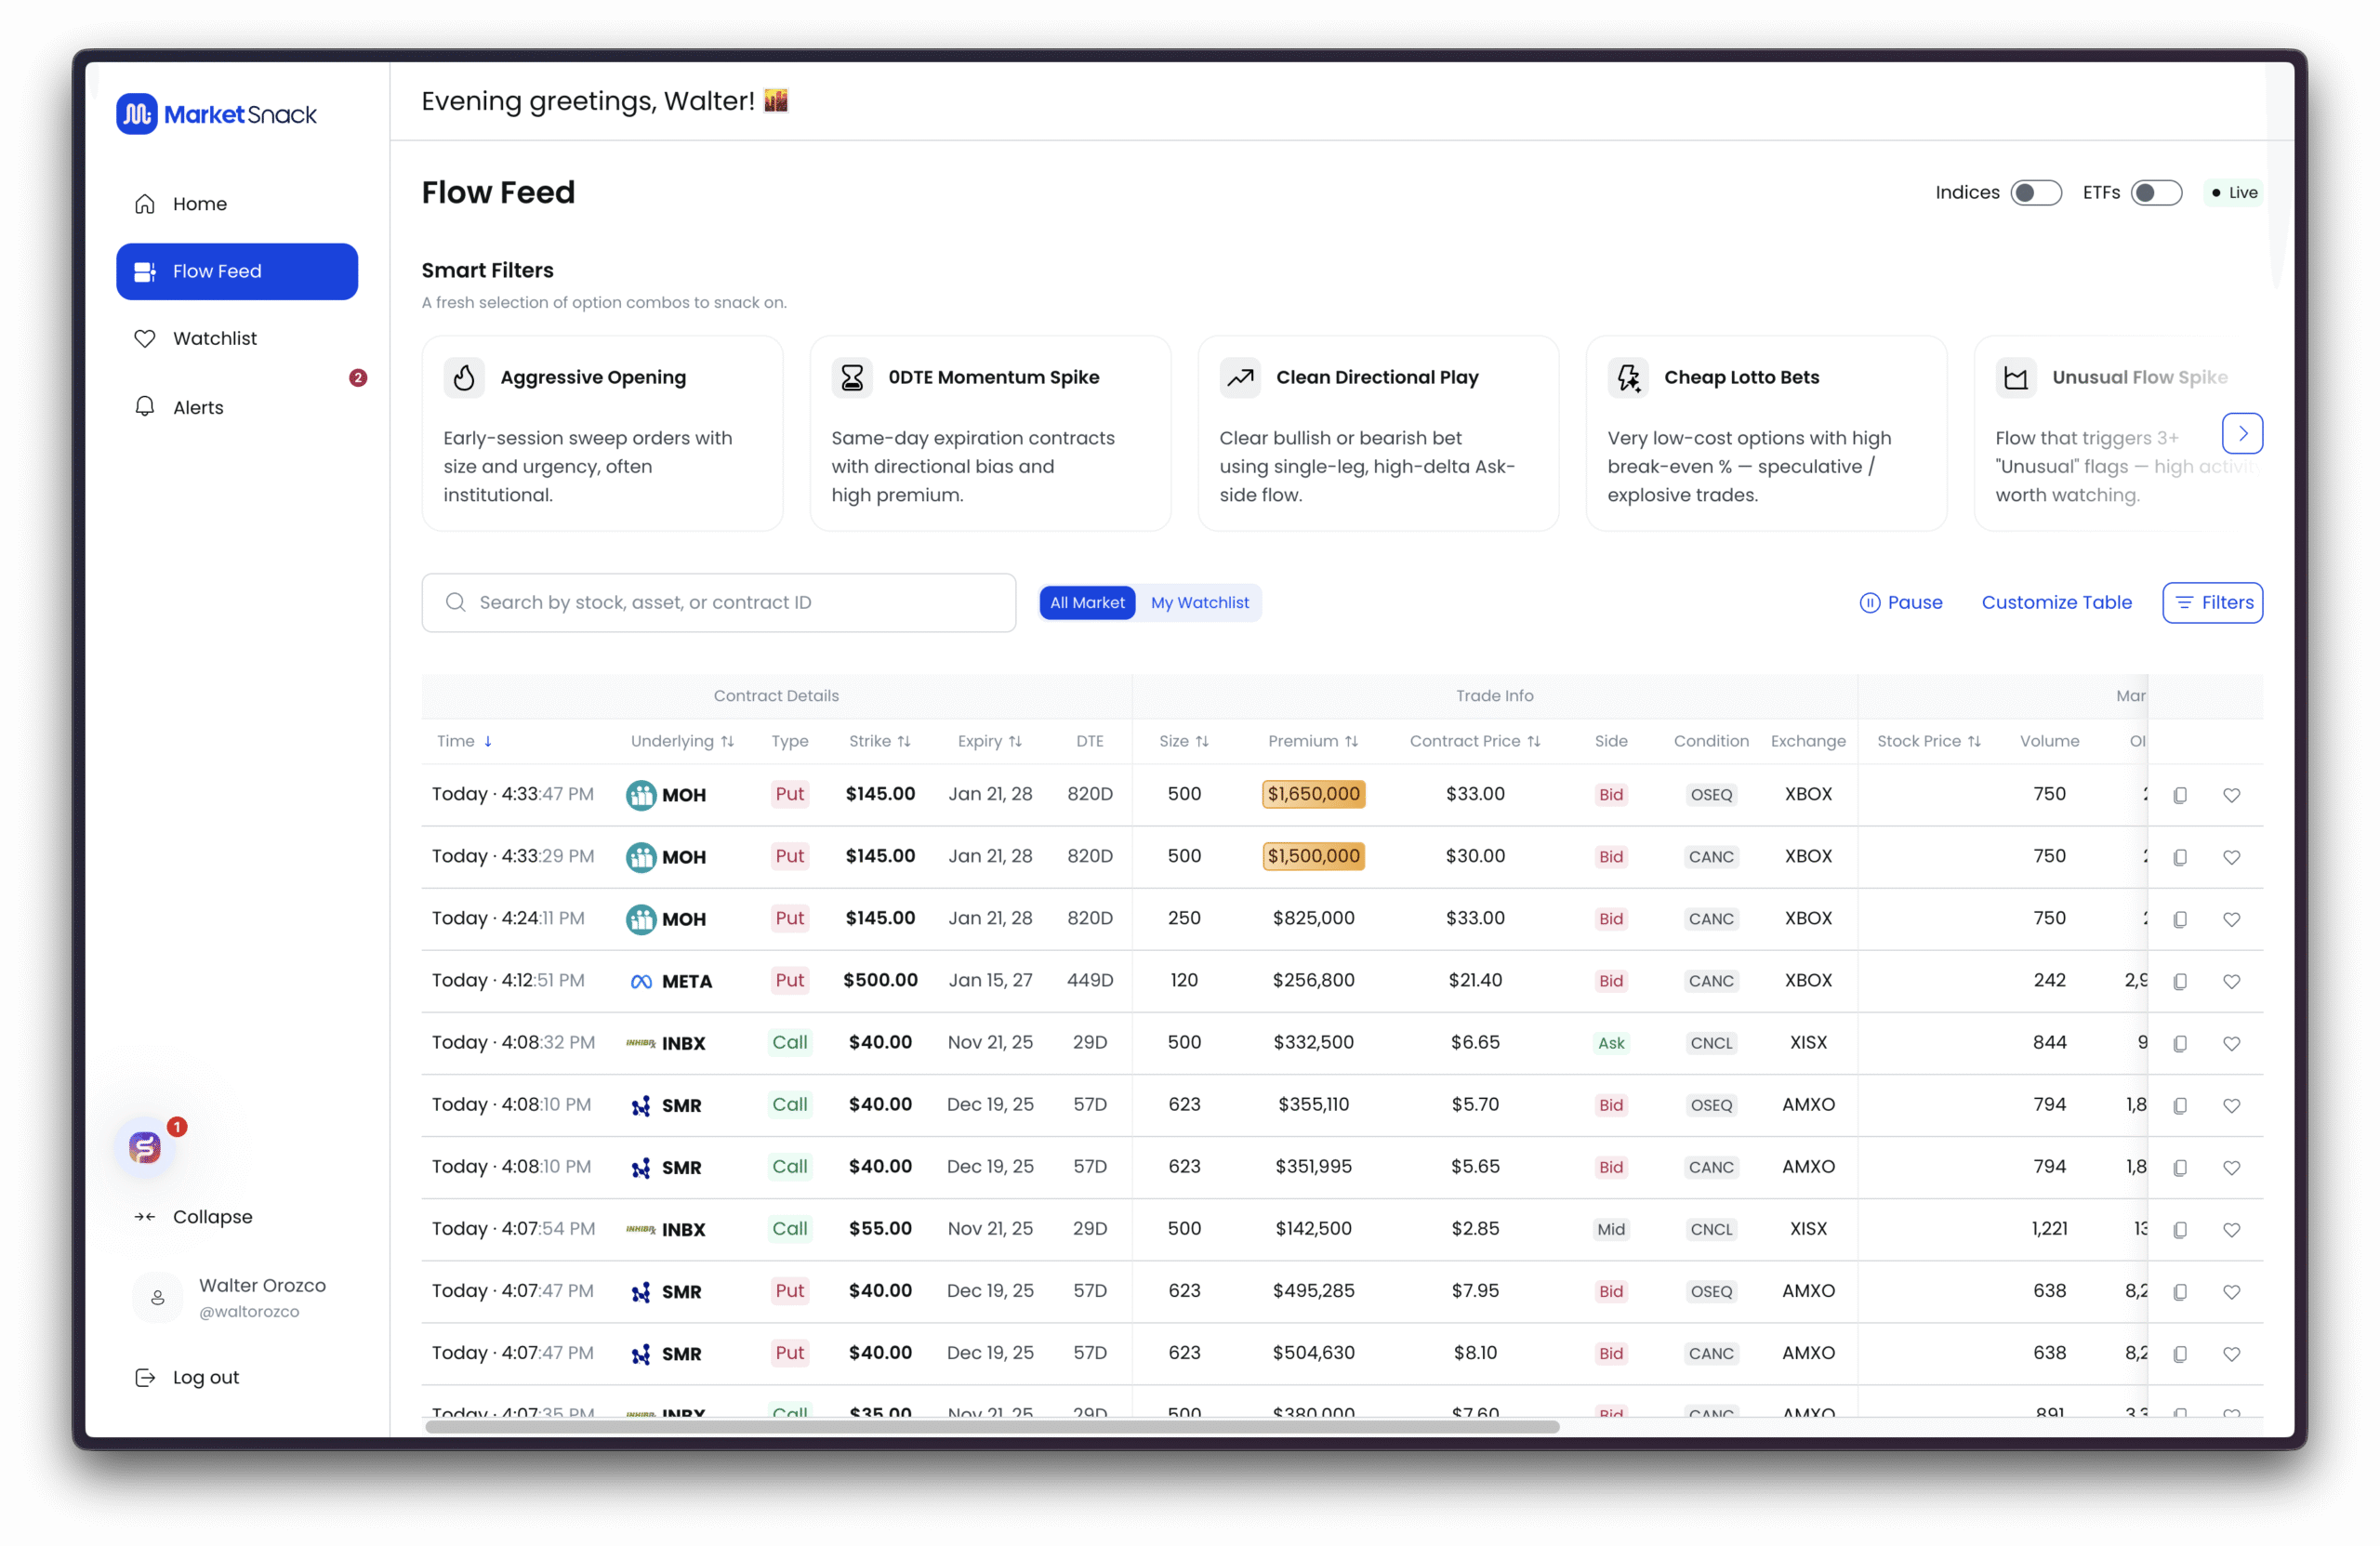
The Flow Feed table is fully customizable. You can choose which columns to display and hide the ones you don’t need. Make sure the columns you want are checked in the menu.
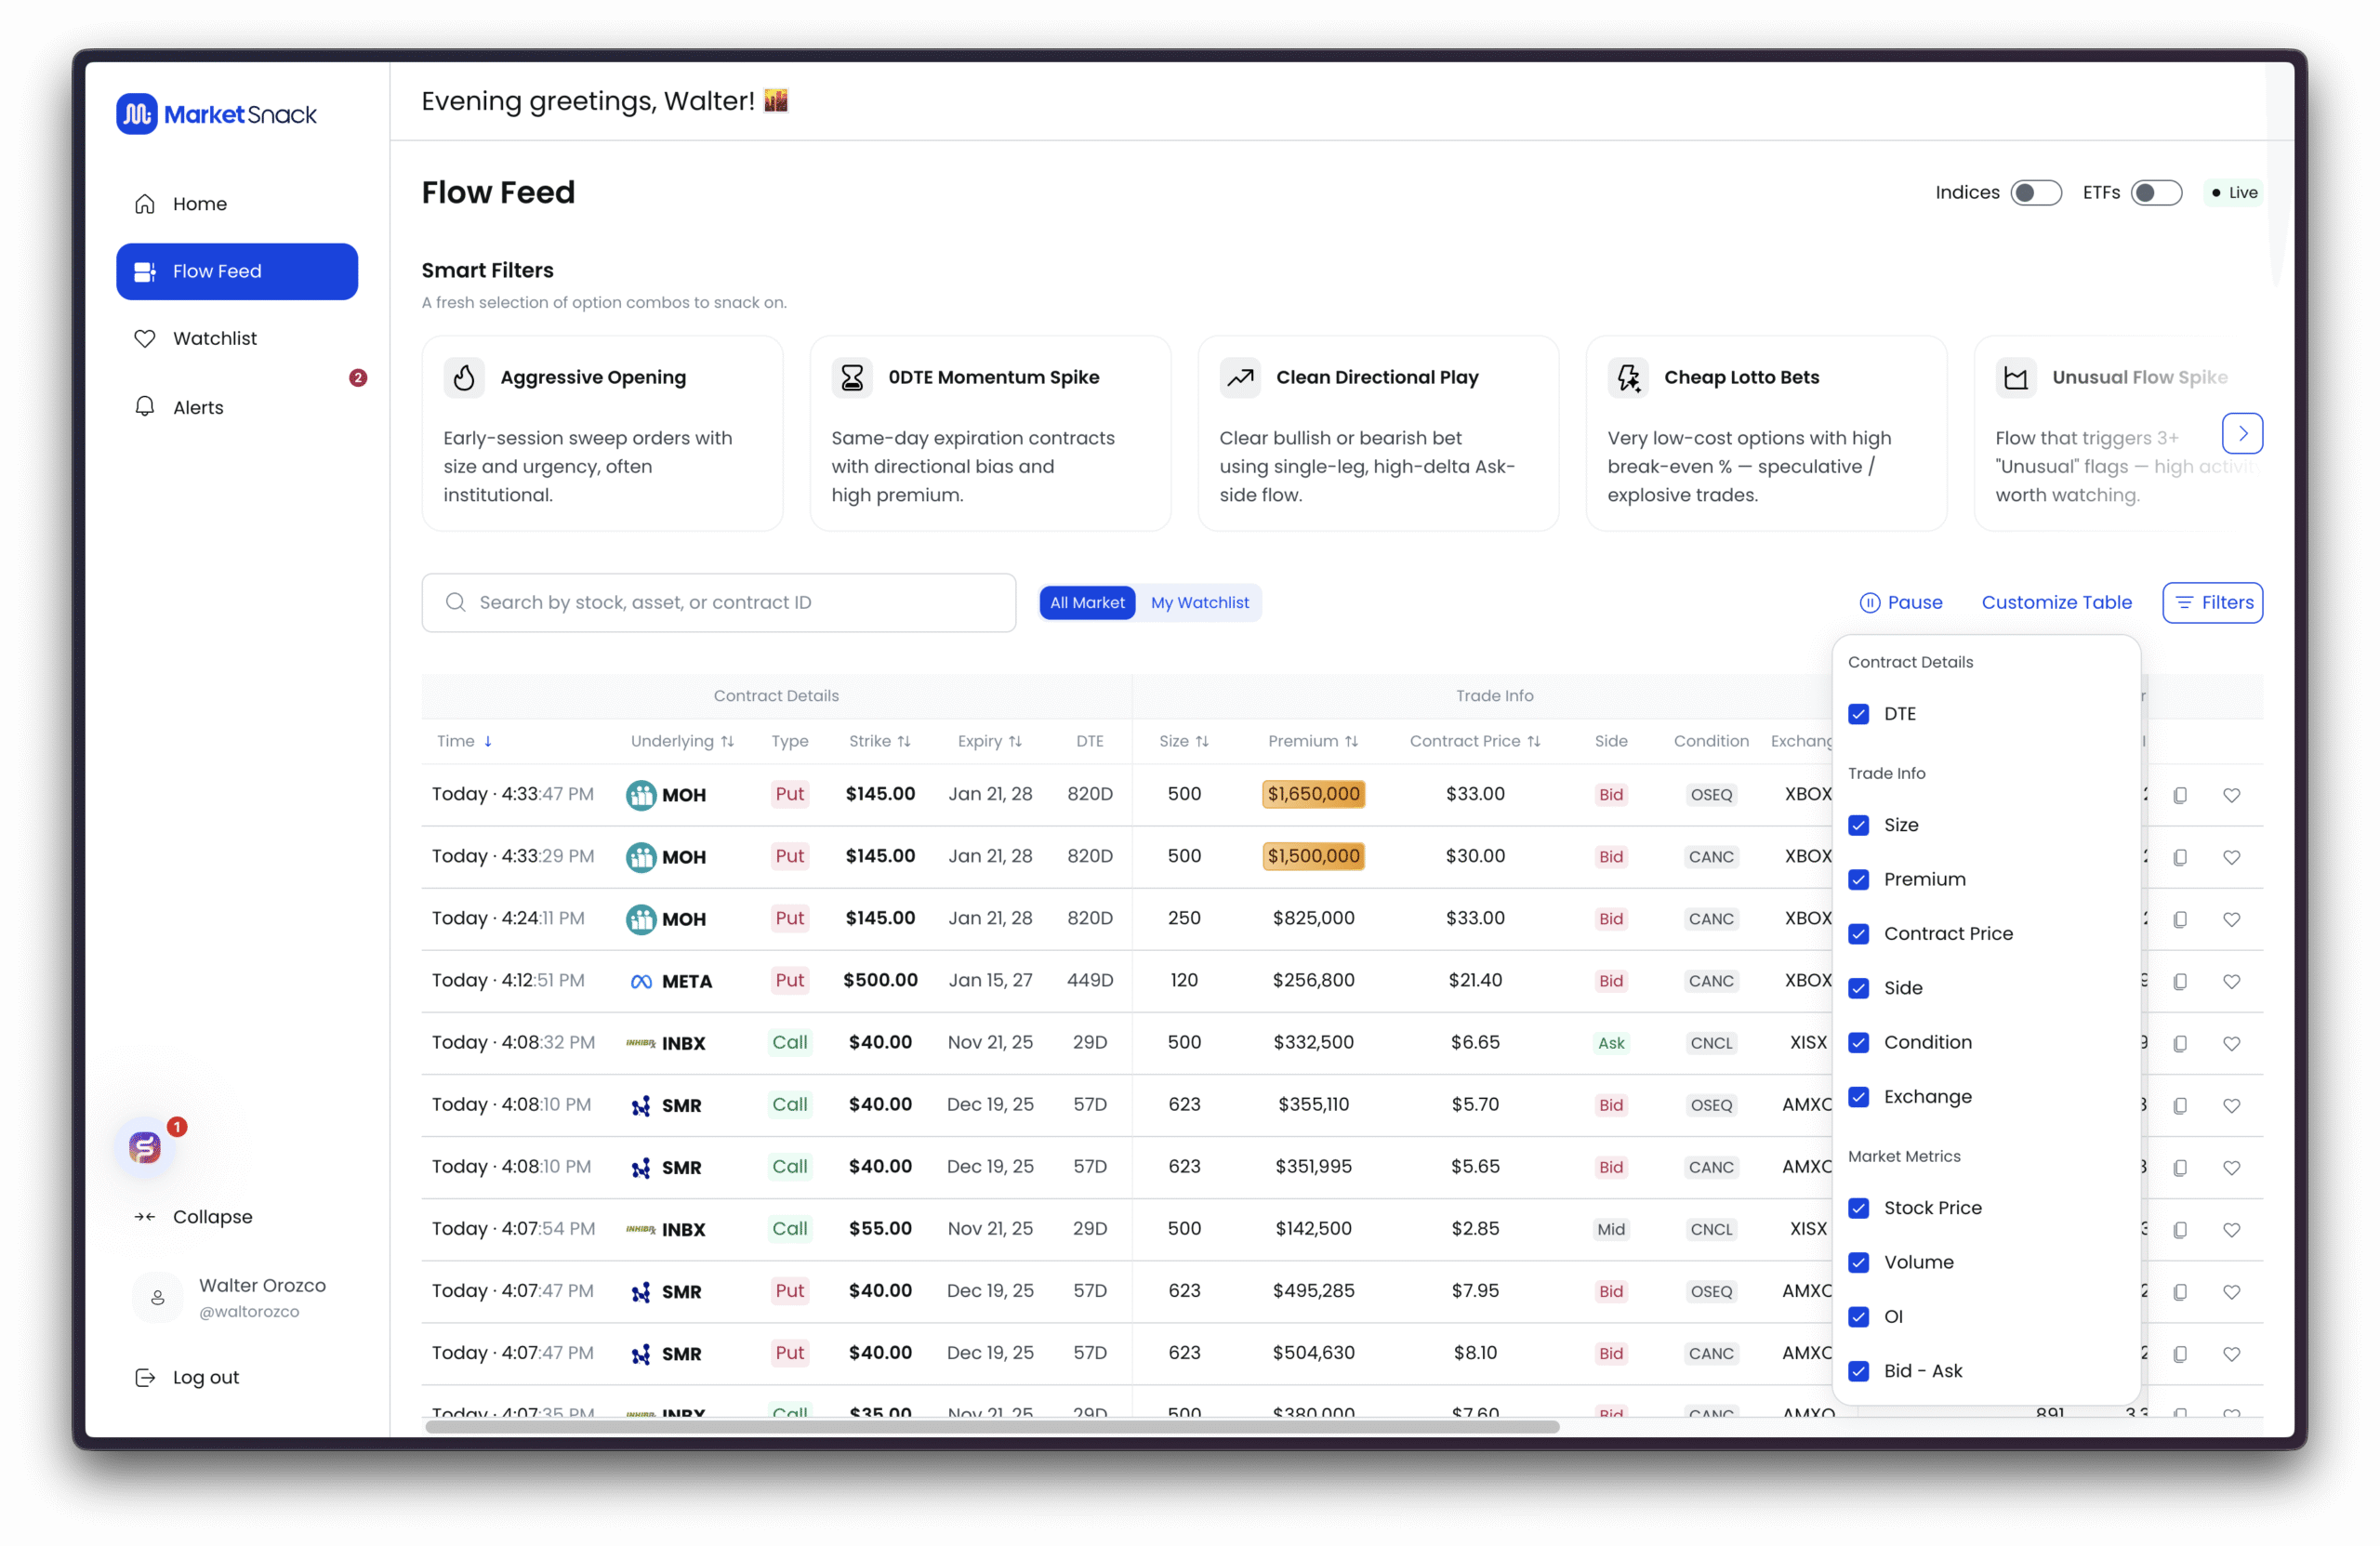
1. Smart Filters
At the top of the Flow Feed, you can apply Smart Filters to surface more specific and useful flows based on your trading style:
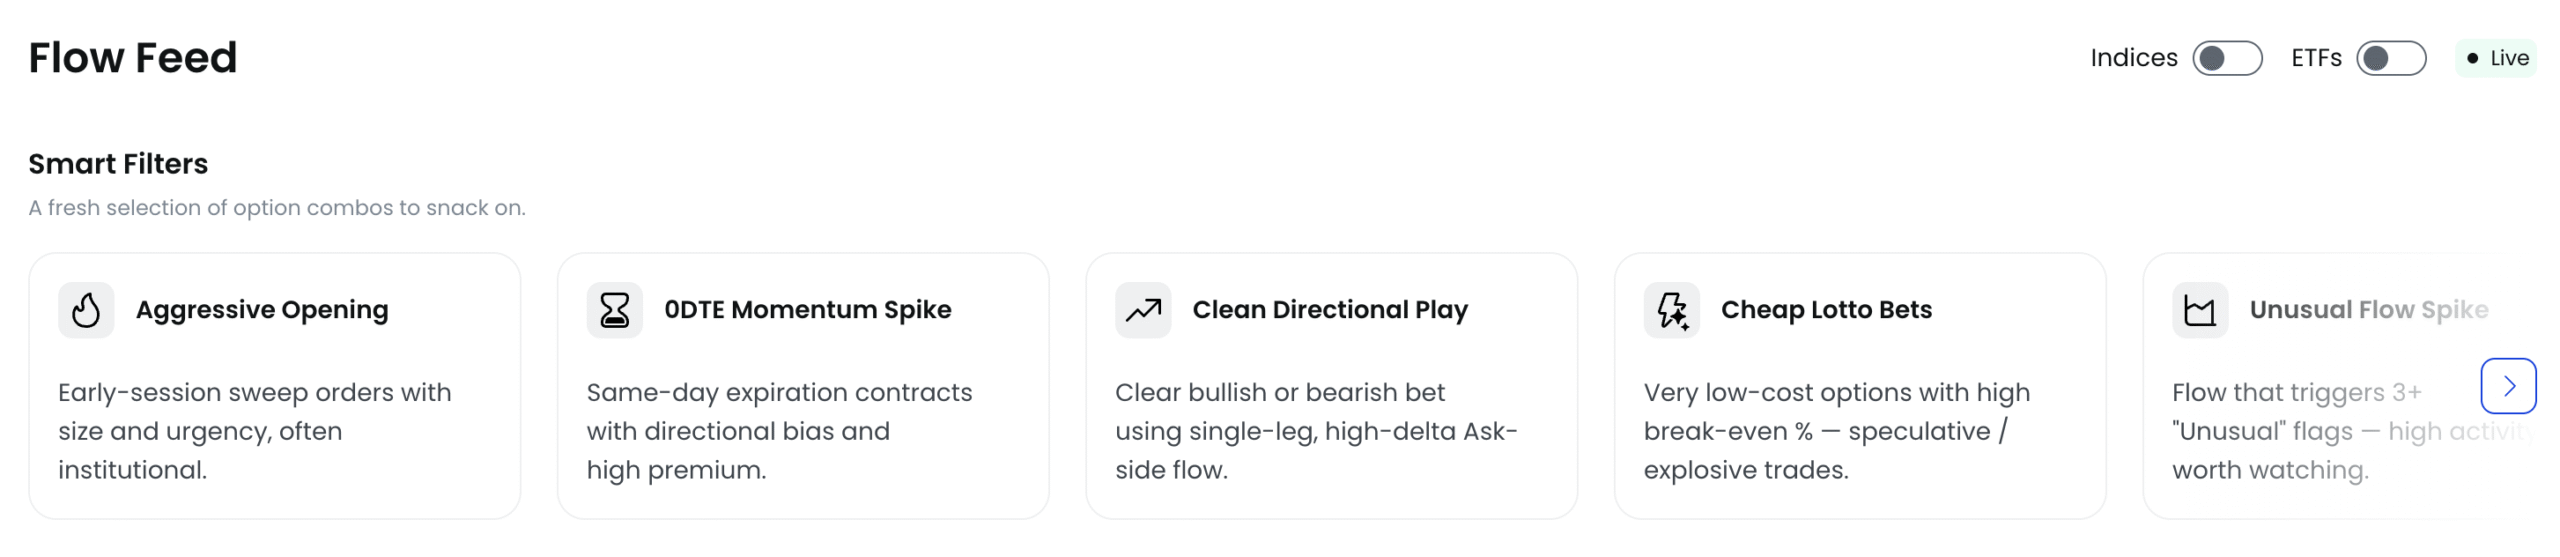
● Aggressive Opening Captures opening-session sweeps with size and urgency, often institutional in nature. Best for spotting early imbalances. Prioritizes prints at the Ask/Above Ask, large sizes, and repeat activity at the same strike/expiration.
● 0DTE Momentum Spike Highlights contracts expiring today (0 Days to Expiration) with directional bias and elevated premiums. Useful for intraday gamma/momentum plays but requires strict risk management due to rapid theta decay.
● Clean Directional Play Clear bullish or bearish bets with a single-leg, high-delta flow (at Ask/Above Ask). A simple directional signal; validate with volume/OI data and nearby technical levels.
● Cheap Lotto Bets Low-cost options with high break-even percentages. These are speculative, explosive
trades aiming for asymmetric payoff on sharp short-term price moves. Best used with small size.
● Unusual Flow Spike Flows that trigger 3+ “Unusual” flags, signaling highly abnormal activity worth following. Prioritize when combined with high premium, repeated prints, and noticeable shifts in IV or volume.
2. Quick Filters
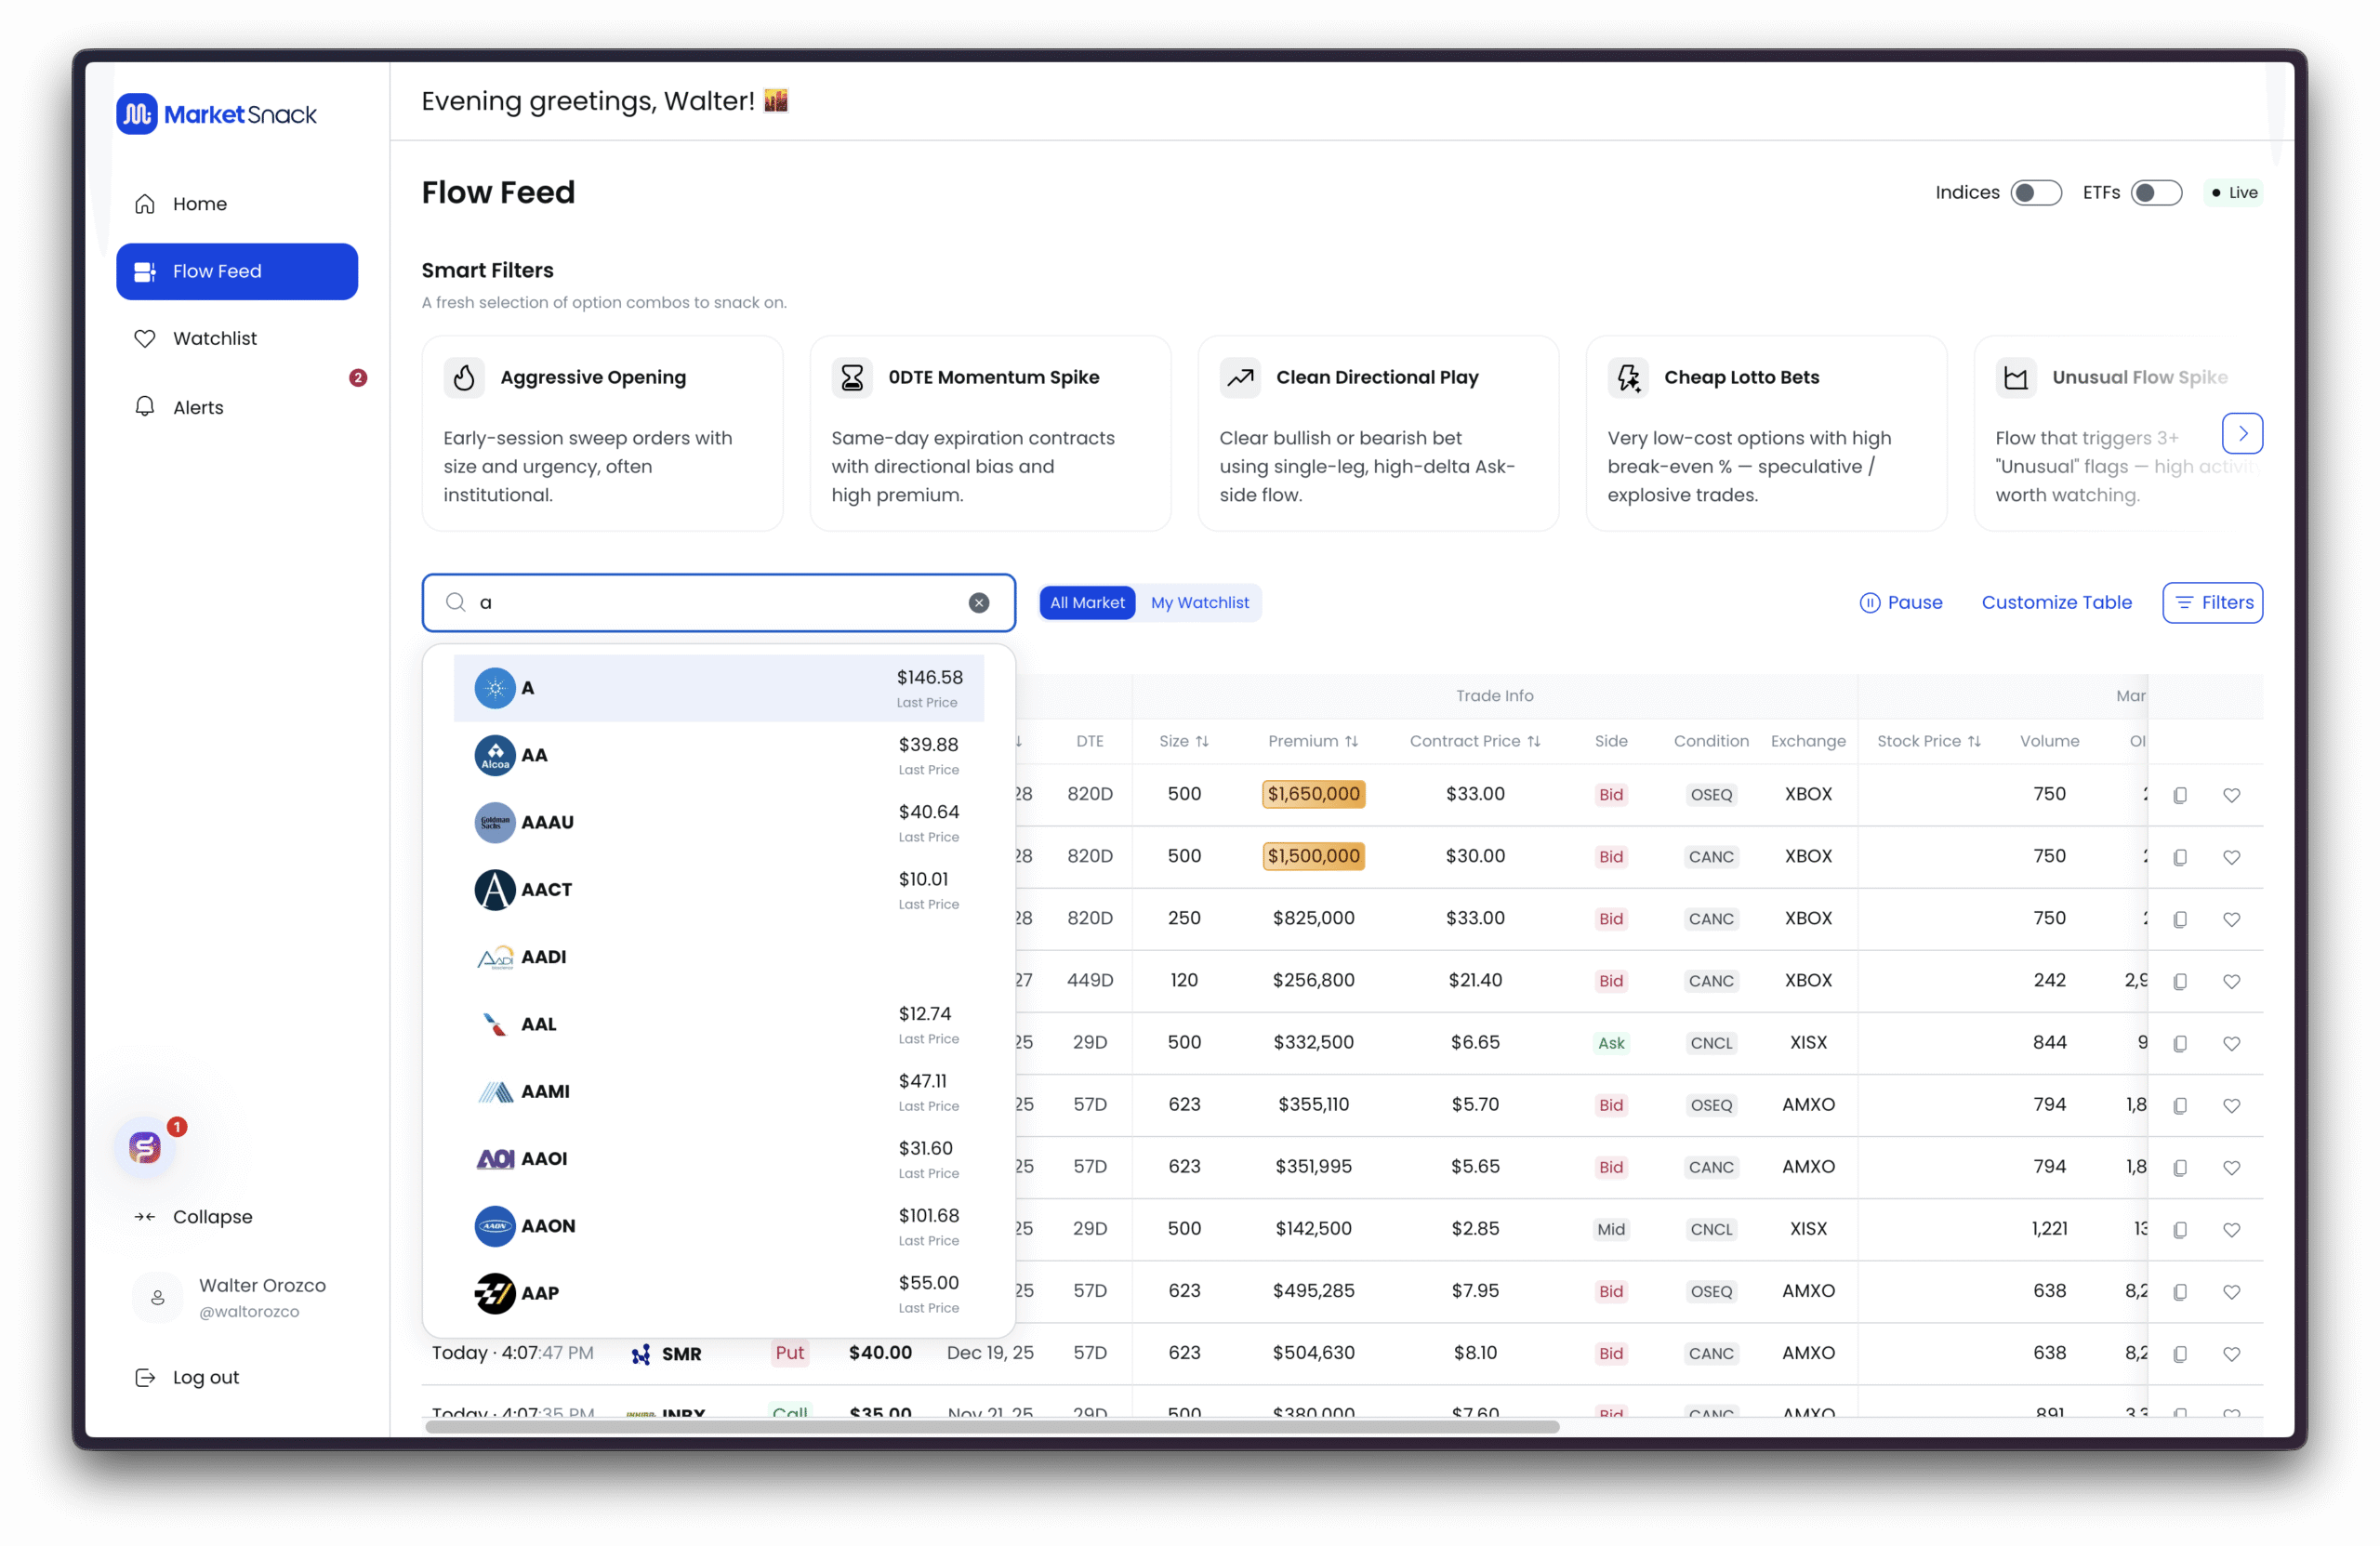
Below the Smart Filters, a search box lets you narrow the Flow Feed by:
● Ticker (e.g., NVDA)
● Underlying asset
● Contract ID
After entering your query and pressing Enter, the table and related modules update to reflect your selection.
3. Market Scope
You can also choose the scope of the Flow Feed:
● All Market – Displays flows across the entire market. Best for discovering new opportunities.
● My Watchlist – Restricts flows to the symbols in your Watchlist. Reduces noise and keeps focus on your tracked names.
What you select here will define what appears in the Flow Feed table and metrics, and also how the Smart Filters and additional filters are applied.
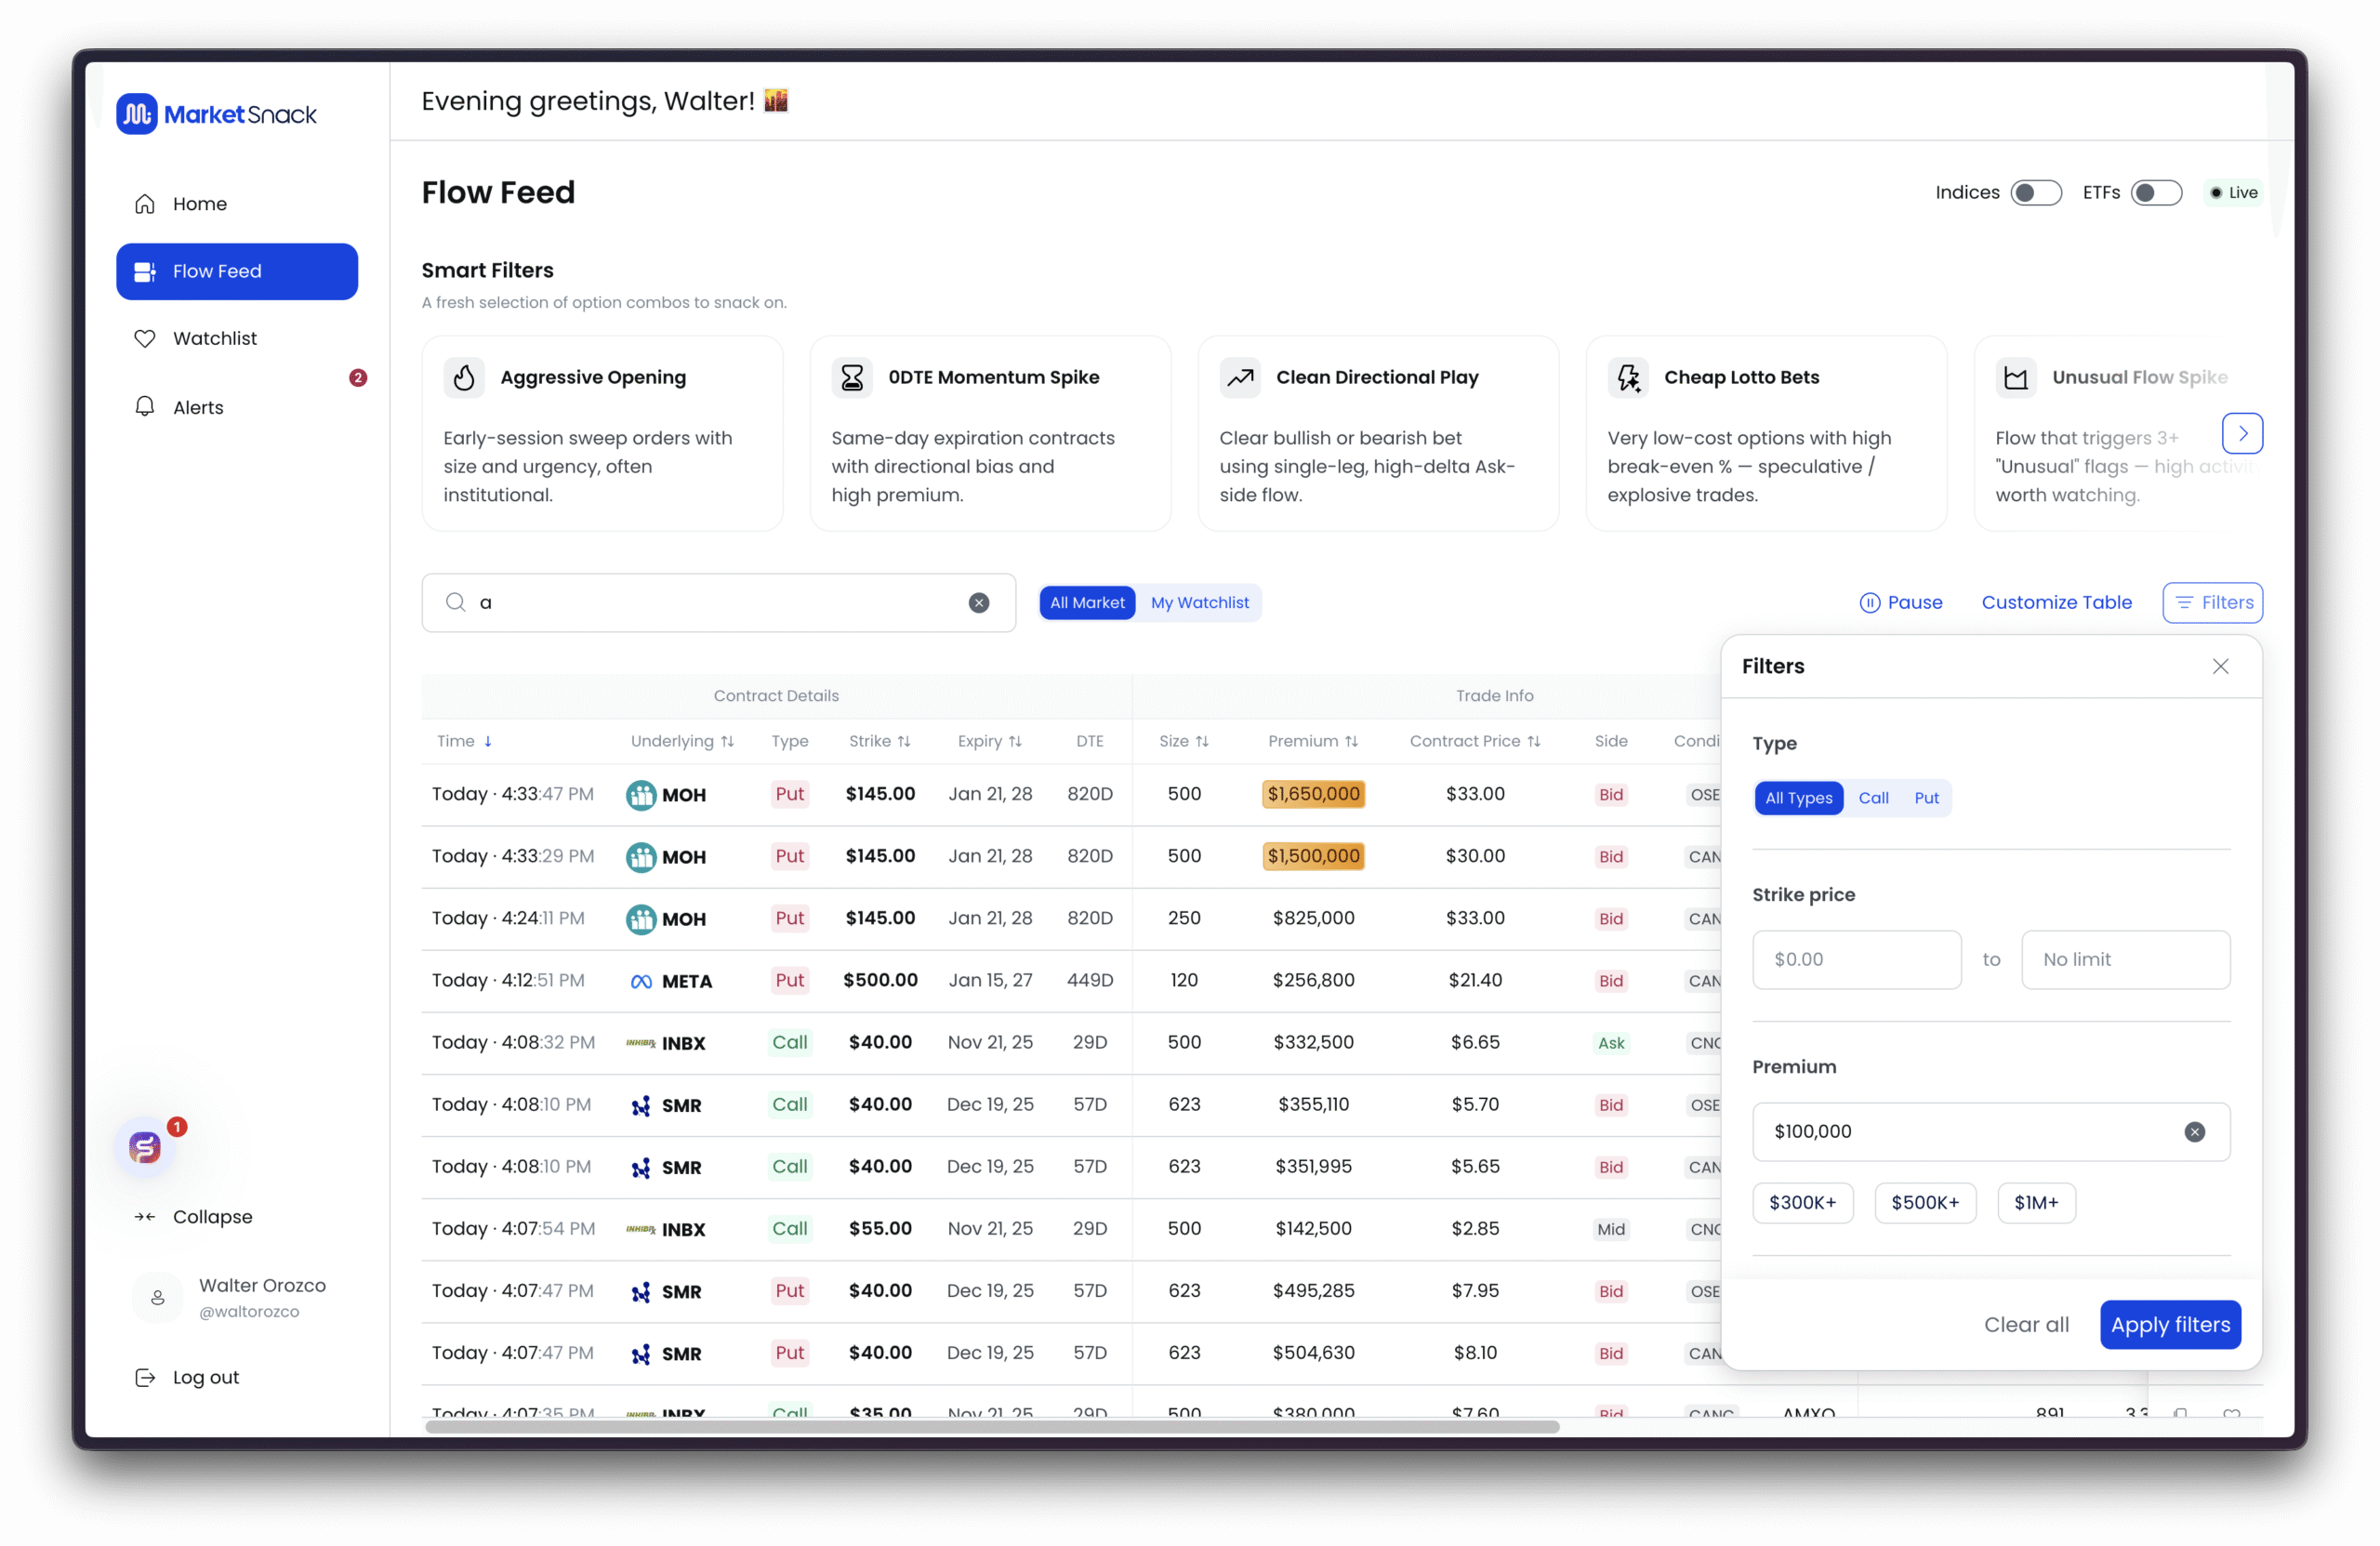
Below is a breakdown of the available filters and how to use them:
● Type
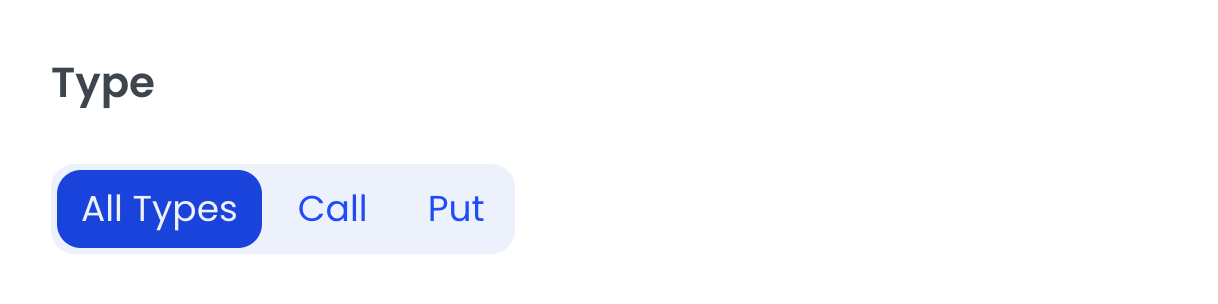
○ All Types – Includes Calls and Puts.
○ Call – Only bullish trades.
○ Put – Only bearish/hedging trades.
● Strike Price (range)
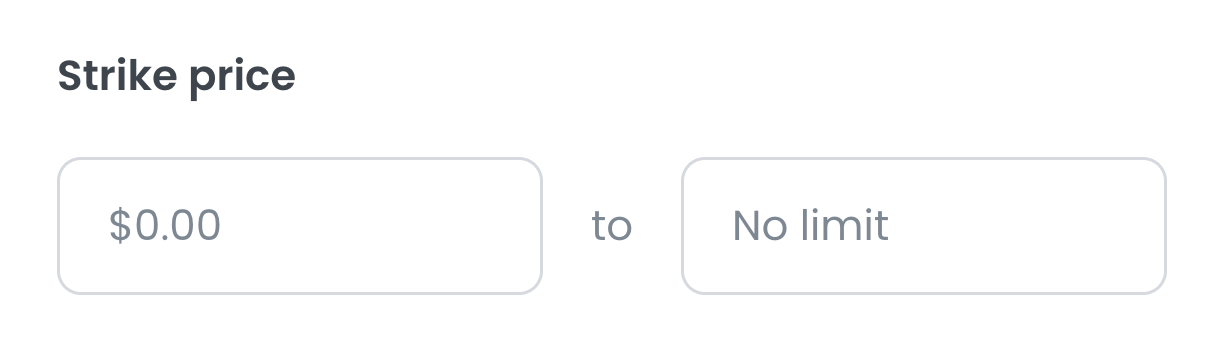
○ Left field = minimum strike; right field = maximum strike (can be set to No limit).
○ Useful for focusing on strikes near or far from the current underlying price.
● Premium
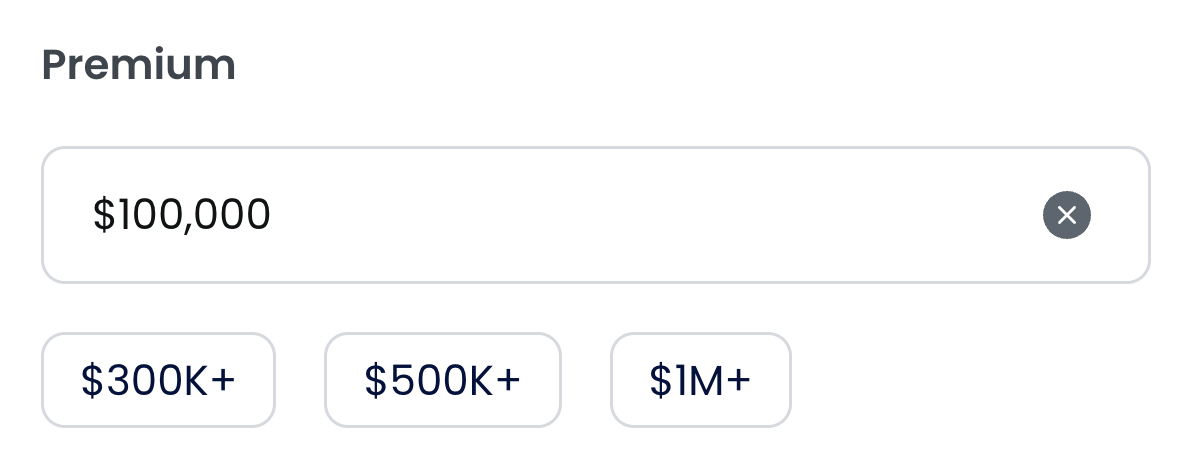
○ Sets the minimum notional value (premium) per trade.
○ Enter a custom value (e.g., $100,000) or use quick shortcuts ($300K+, $500K+, $1M+).
○ The × icon clears the field.
○ Higher thresholds reduce noise and surface more “large/institutional” flows.
○ Note: By default, the Flow Feed is pre-filtered to show trades with a premium above $100K, ensuring that the feed highlights unusual, higher-value activity rather than small, less relevant prints.
● Side
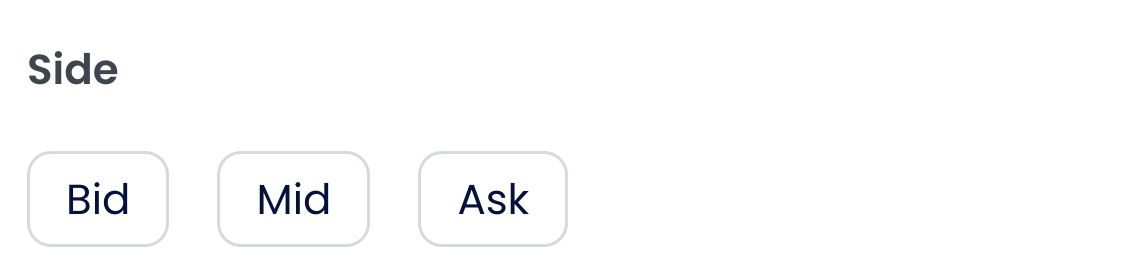
○ Bid – Aggressive selling prints.
○ Mid – Midpoint prints (less directional).
○ Ask – Aggressive buying prints.
○ Use to prioritize conviction (Ask) vs. potential exits/hedges (Bid).
● Session Date
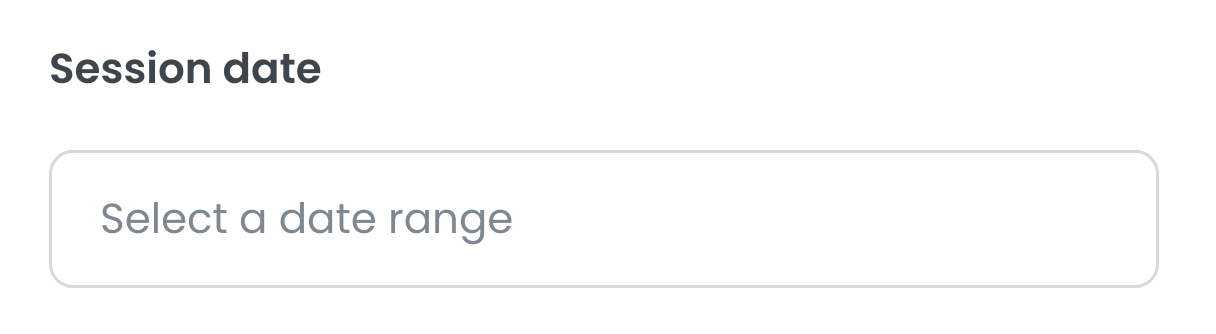
○ Filters results by session date range (e.g., today, last week).
○ Ideal for reviewing recent history or comparing periods.
● Expiration Date
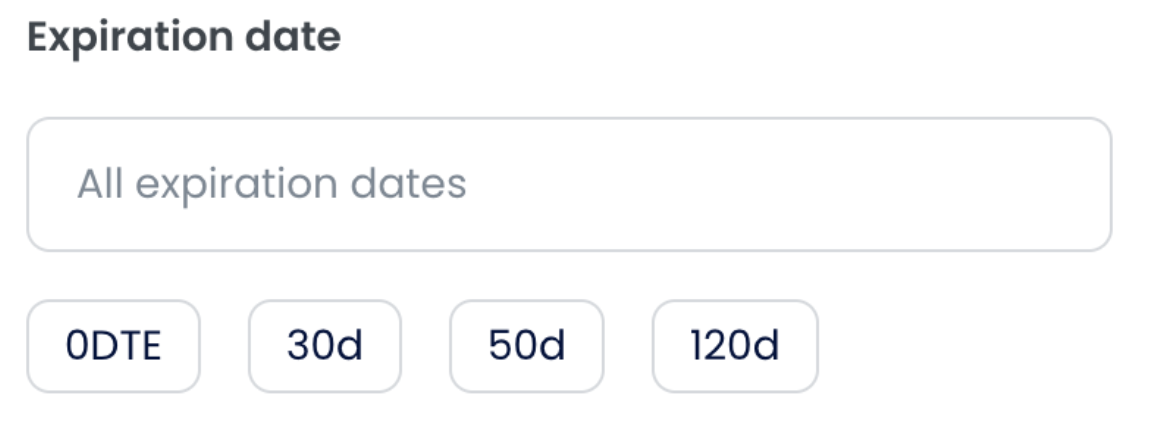
○ Filters by contract expiration.
○ Enter a custom range or use shortcuts:
■ 0DTE – Expires today (ultra-tactical).
■ 30d / 50d / 120d – Contracts expiring in ~30/50/120 days (swing/strategic).
● Condition
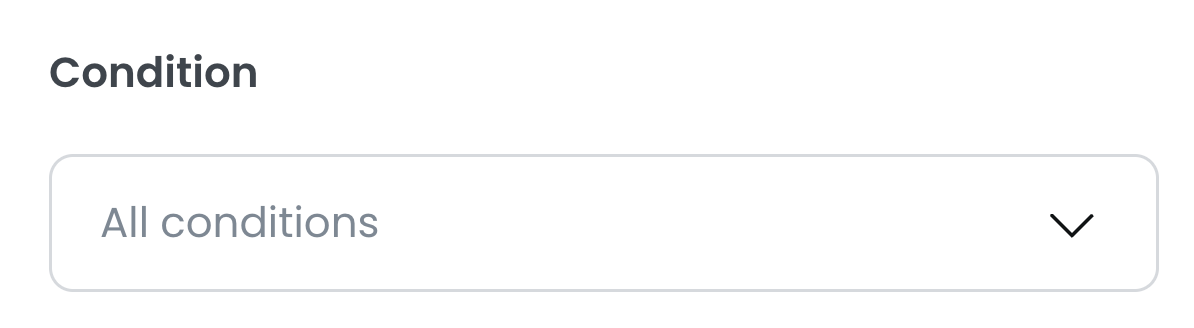
○ Filters by trade condition reported by the exchange/feed.
○ All conditions – No restriction.
○ Select one or more conditions to focus on specific trade types.
○ Useful for excluding “noise” and isolating higher-quality prints.
● Size
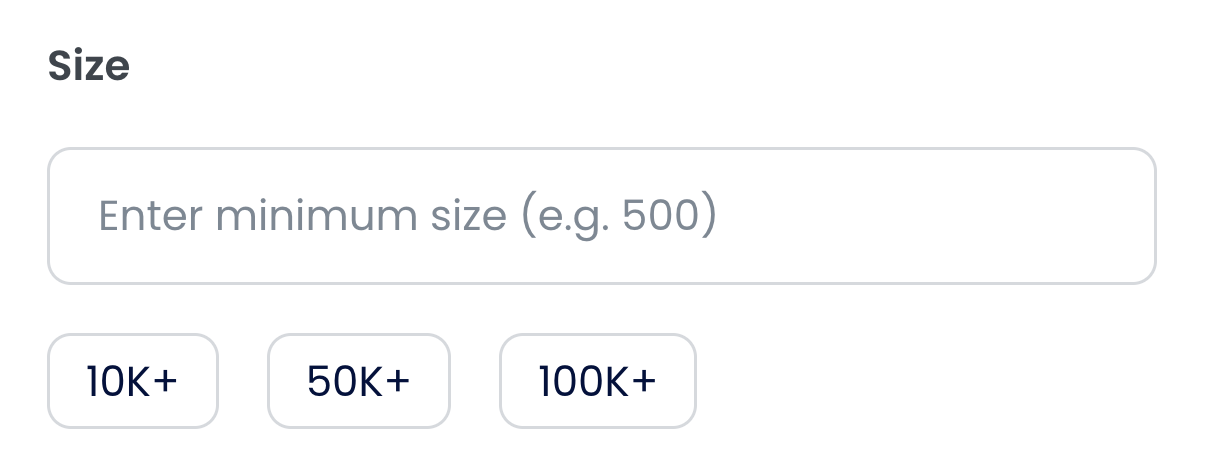
○ Sets the minimum trade size in number of contracts.
○ Enter a custom value (e.g., 500) or use quick shortcuts (10K+, 50K+, 100K+).
○ Larger size = fewer but more relevant signals.
● Open Interest (OI)
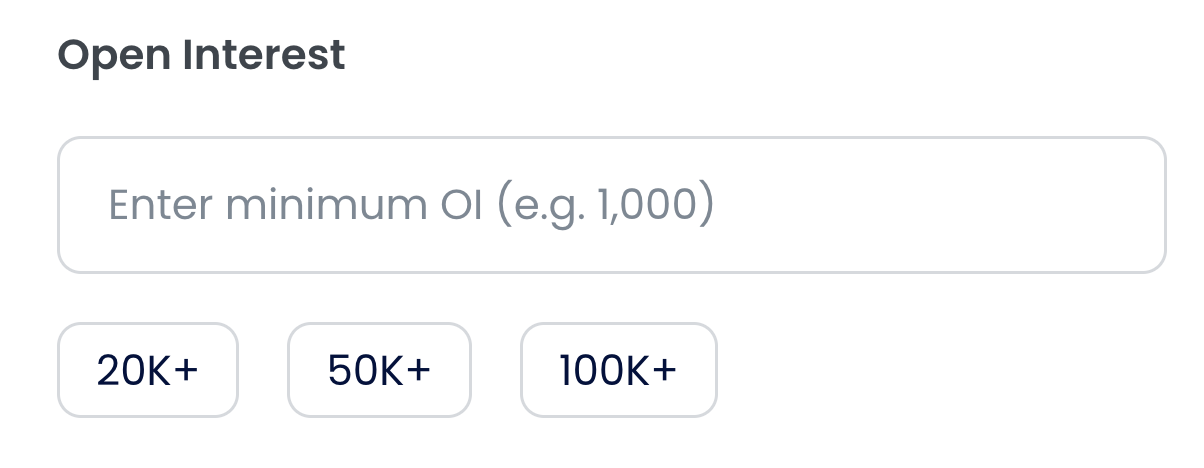
○ Sets the minimum open interest of the contract.
○ Enter a custom value or use shortcuts (20K+, 50K+, 100K+).
○ Raising this threshold avoids illiquid contracts and wide spreads.
Delta
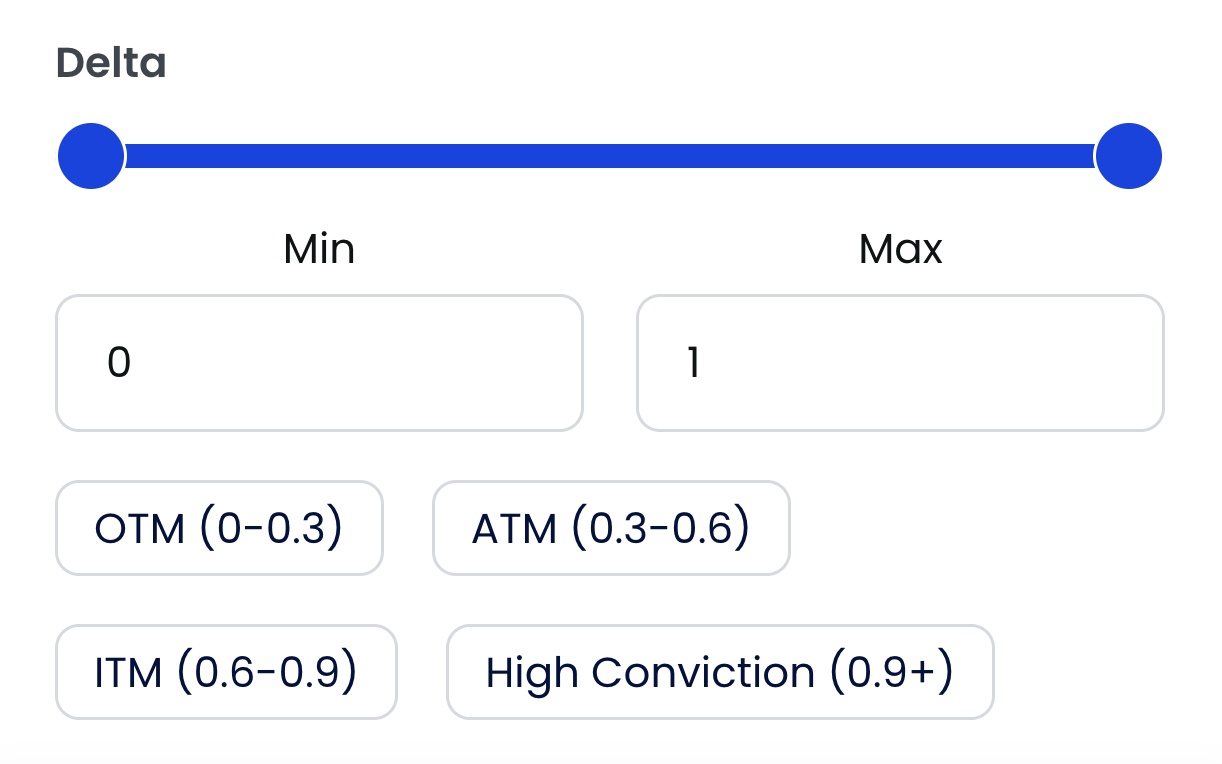
Controls how sensitive the option is to changes in the underlying asset. Use the slider or Min/Max fields (0–1), or select presets:
● OTM (0–0.3) – Out-of-the-money; cheaper, high leverage, lower probability.
● ATM (0.3–0.6) – At-the-money; balanced cost and responsiveness.
● ITM (0.6–0.9) – In-the-money; higher premium, more stable/high probability.
● High Conviction (0.9+) – Deep ITM; stock-like movement, very directional, strong conviction or hedge.
Menu Options
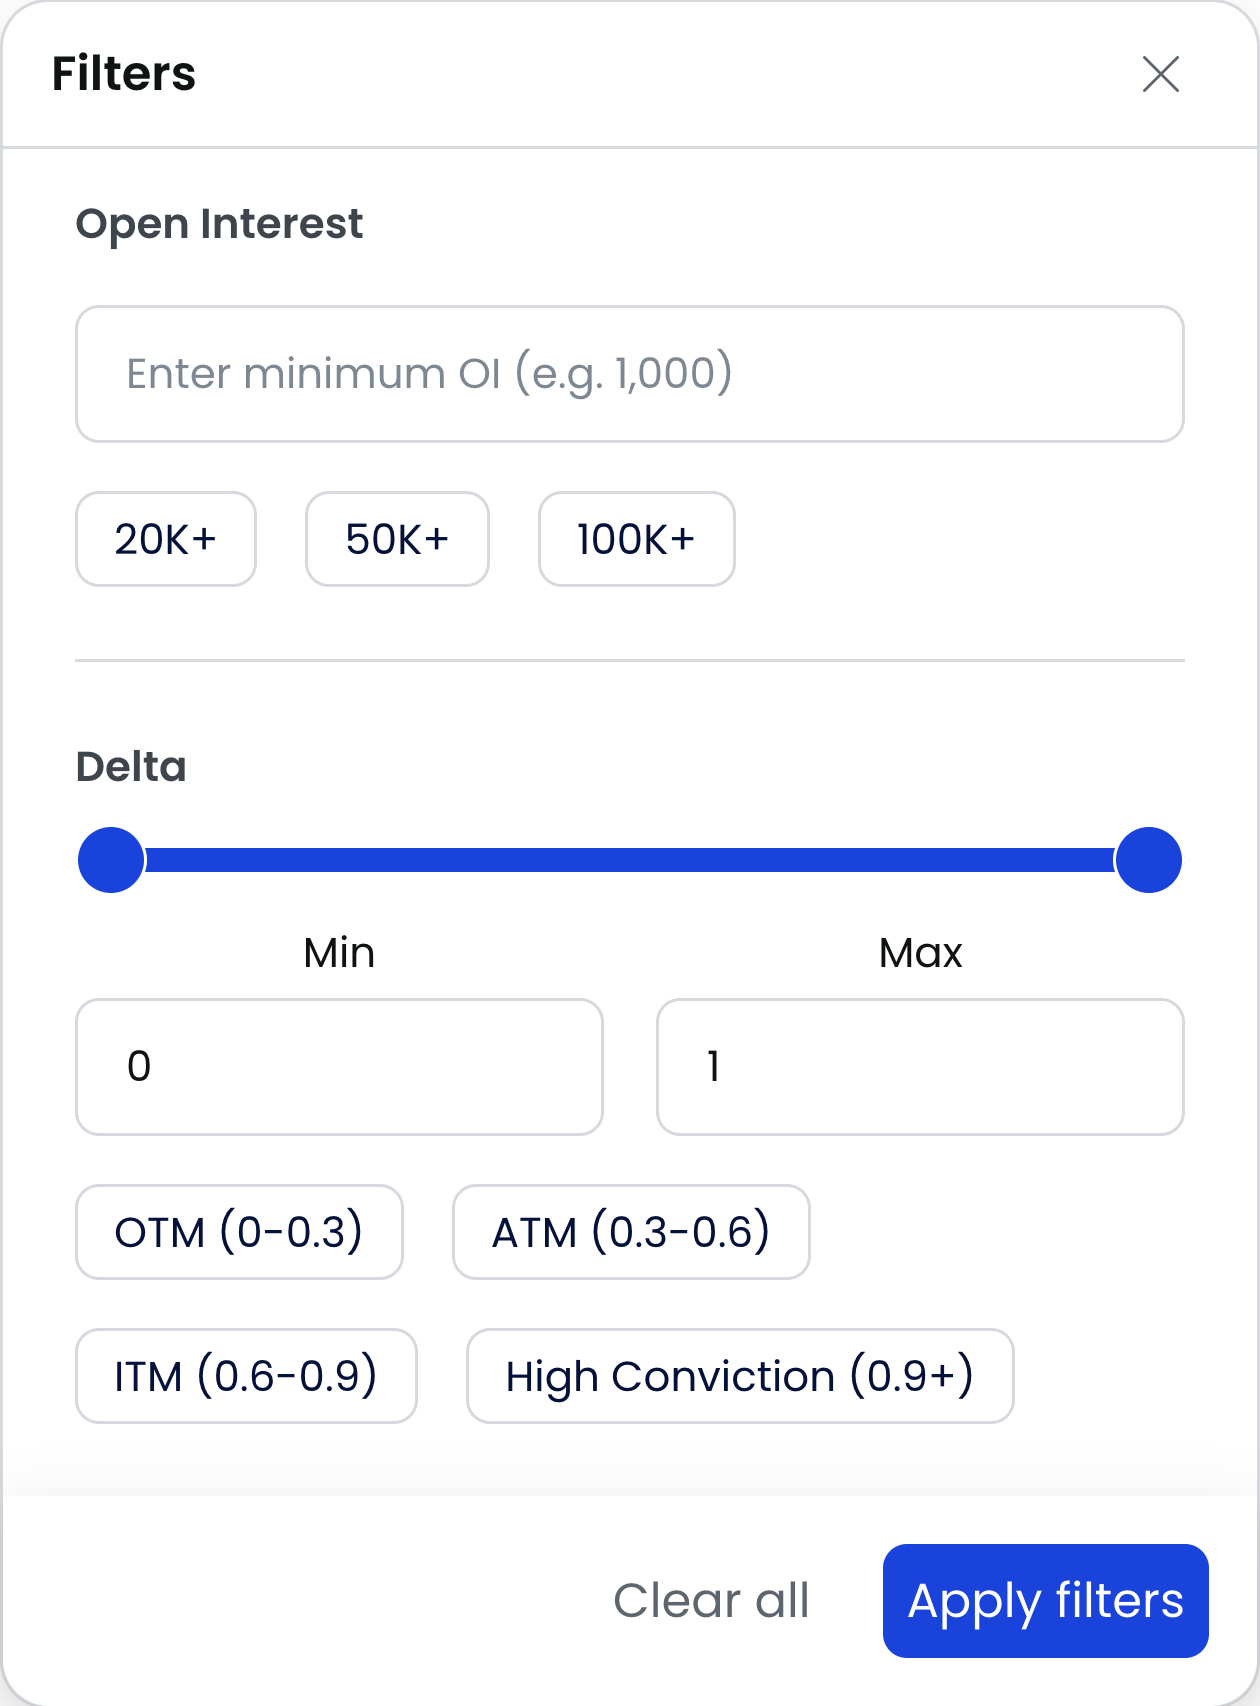
● Clear All – Resets all filters and returns to an unrestricted view.
● Apply Filters – Applies the selected criteria to the current table view.
Tips for Using Filters
● To find large directional call flows: set Type → Call and Premium ≥ $500K; leave Strike Price as No limit for broad coverage.
● To catch intraday momentum: combine Side = Ask with 0DTE. For strategic positioning, use 30–120d expirations.
● To focus on large institutional flows: use high Size + OI thresholds, and refine further with Condition for quality prints.
● For intraday momentum: target ATM/ITM contracts. For institutional tracking/hedging: focus on ITM / 0.9+ Delta, combined with Side = Ask for strong conviction signals.
Configuring Alerts – Step by Step
1. Access the Alerts Section
From the sidebar, click on the bell icon (Alerts). This will open the Alerts dashboard.
2. Create a New Alert
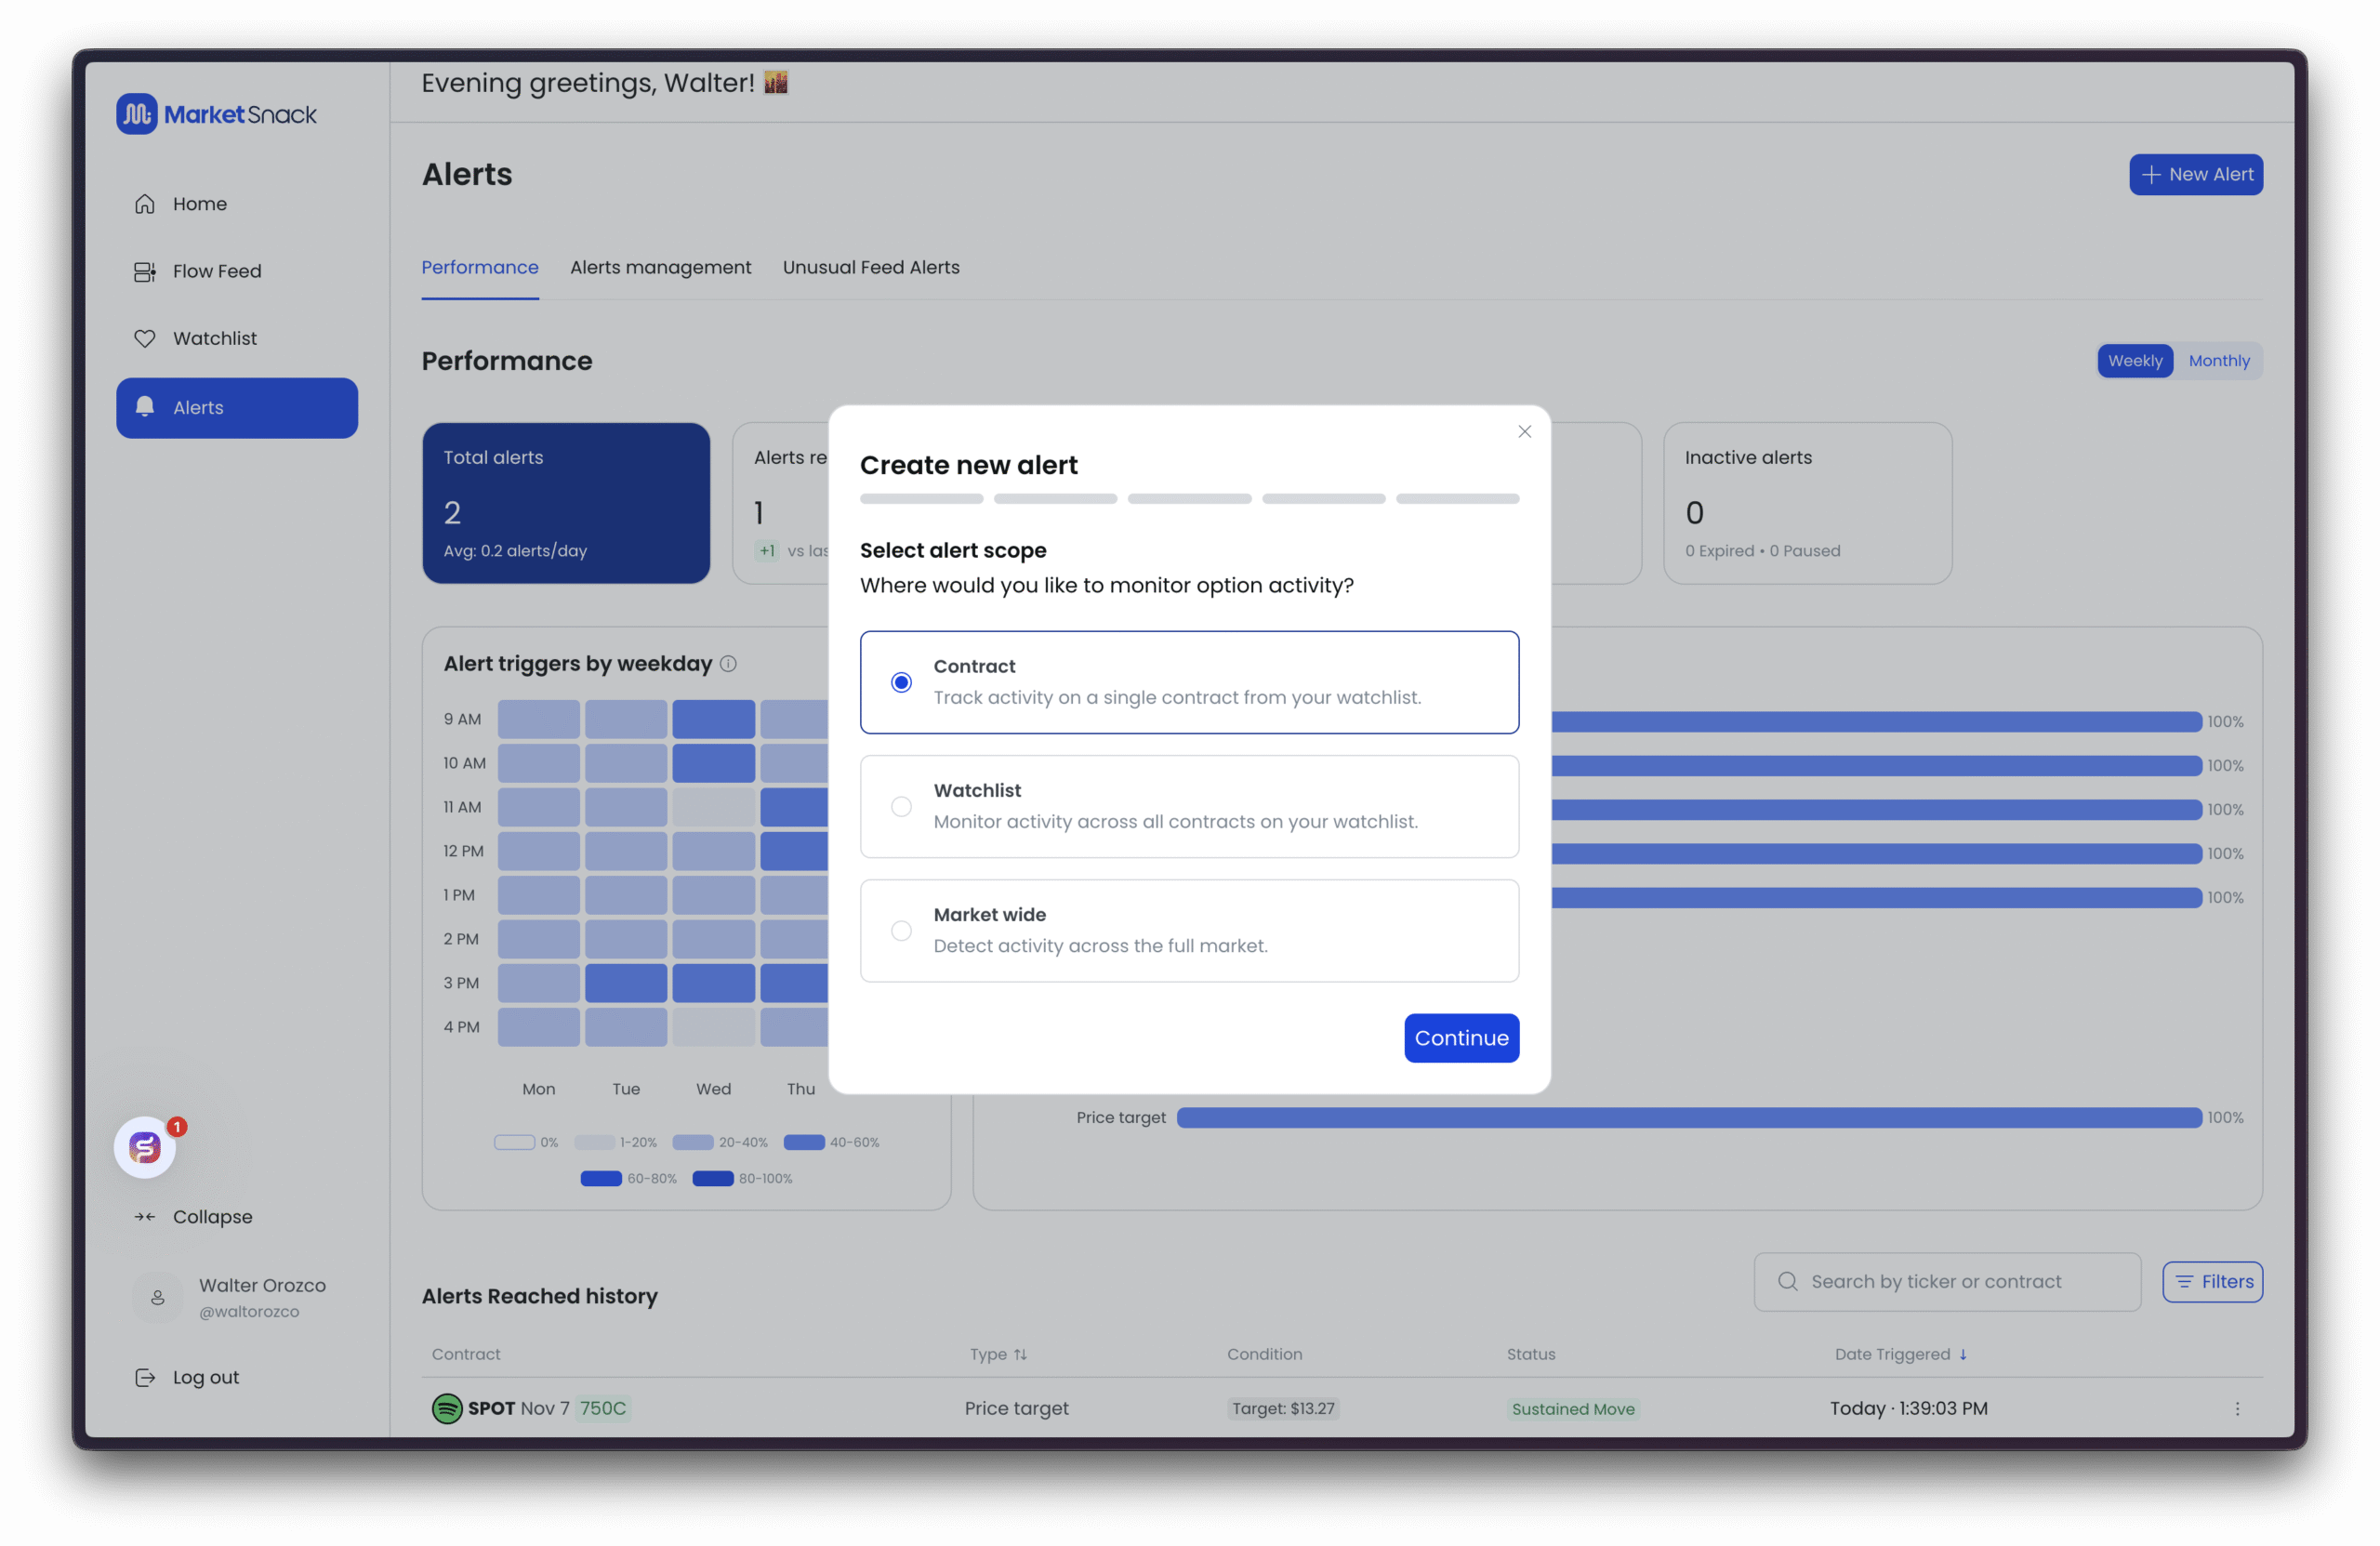
Click New Alert in the top-right corner. You’ll then see three types of alerts to choose from:
● Contract – Monitors the activity of a specific contract (e.g., an option already in your Watchlist). Ideal for precise alerts such as contract price, contract volume/open interest, or very targeted changes. Minimal noise, full focus.
● Watchlist – Applies alert conditions to all contracts or symbols in your Watchlist. Useful for applying the same rules (price, volume, sentiment, news) to multiple assets at once. Saves time, but may generate more alerts if your list is large.
● Market Wide – Scans the entire market without limiting to your Watchlist. Best for discovering new opportunities (volume spikes, unusual activity, news events). It is the broadest setting and may produce more alerts, so fine-tuning filters/thresholds is recommended.
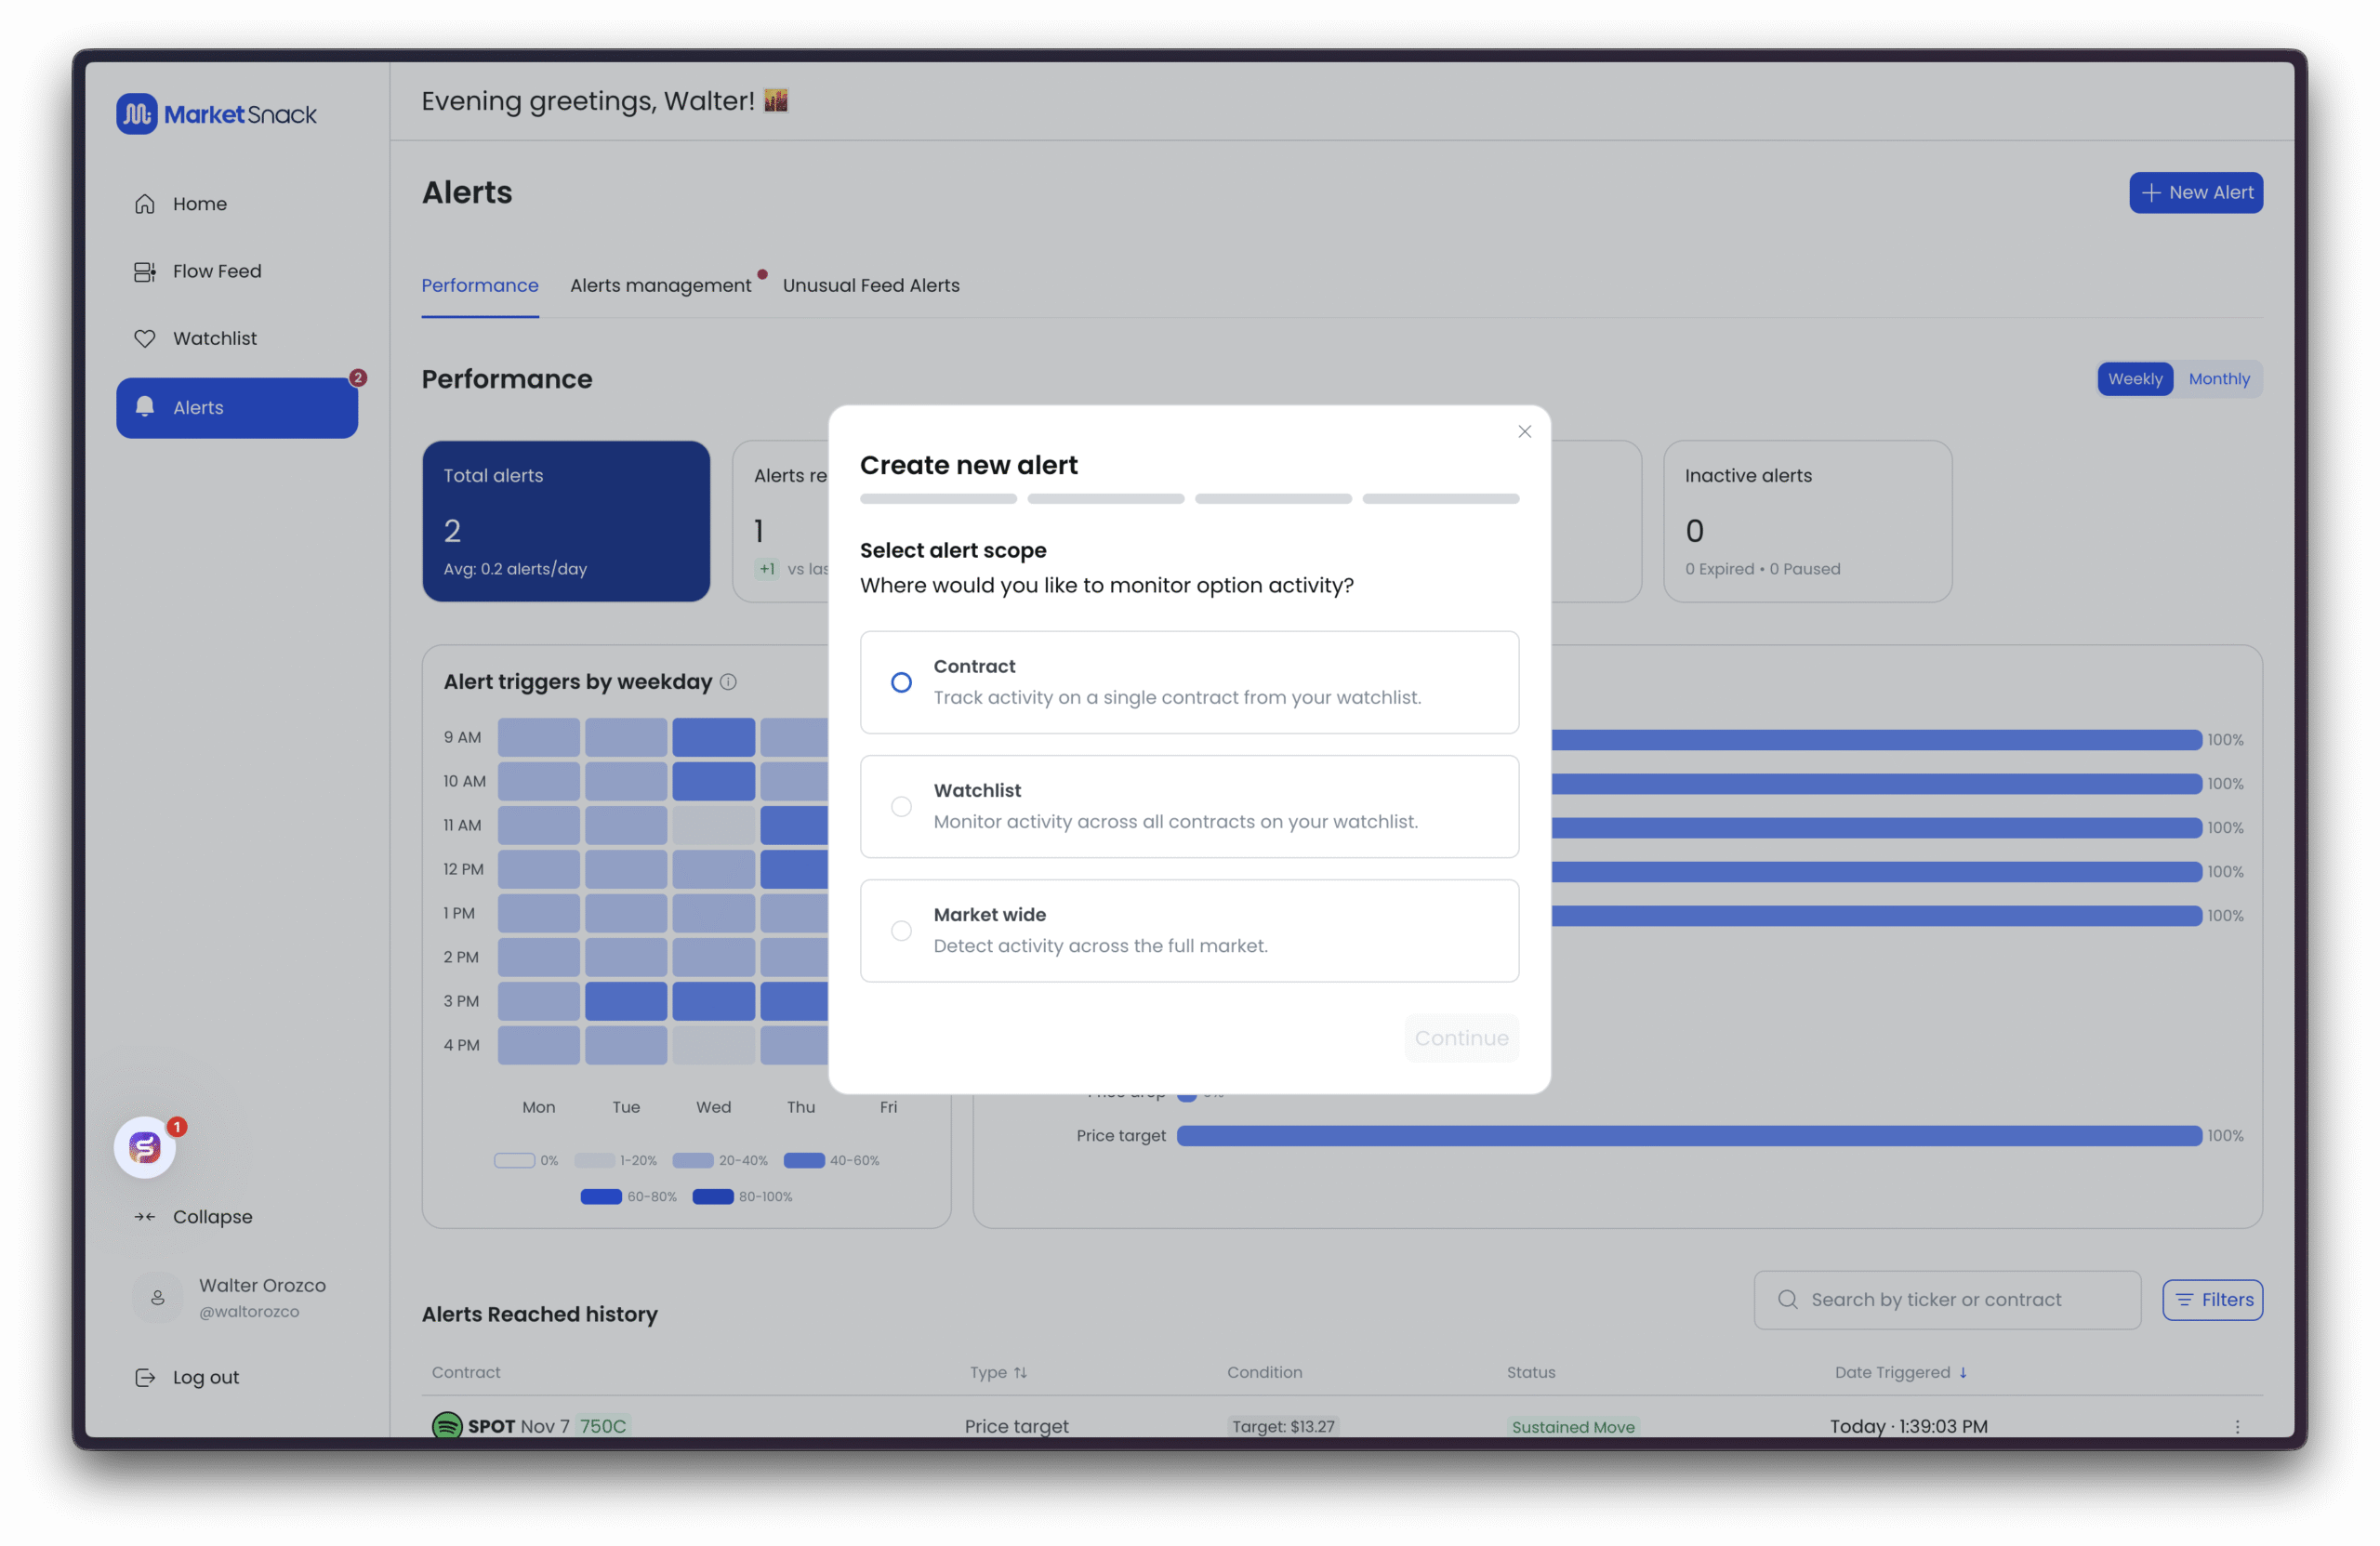
For this example, we’ll create a Market Wide Alert.
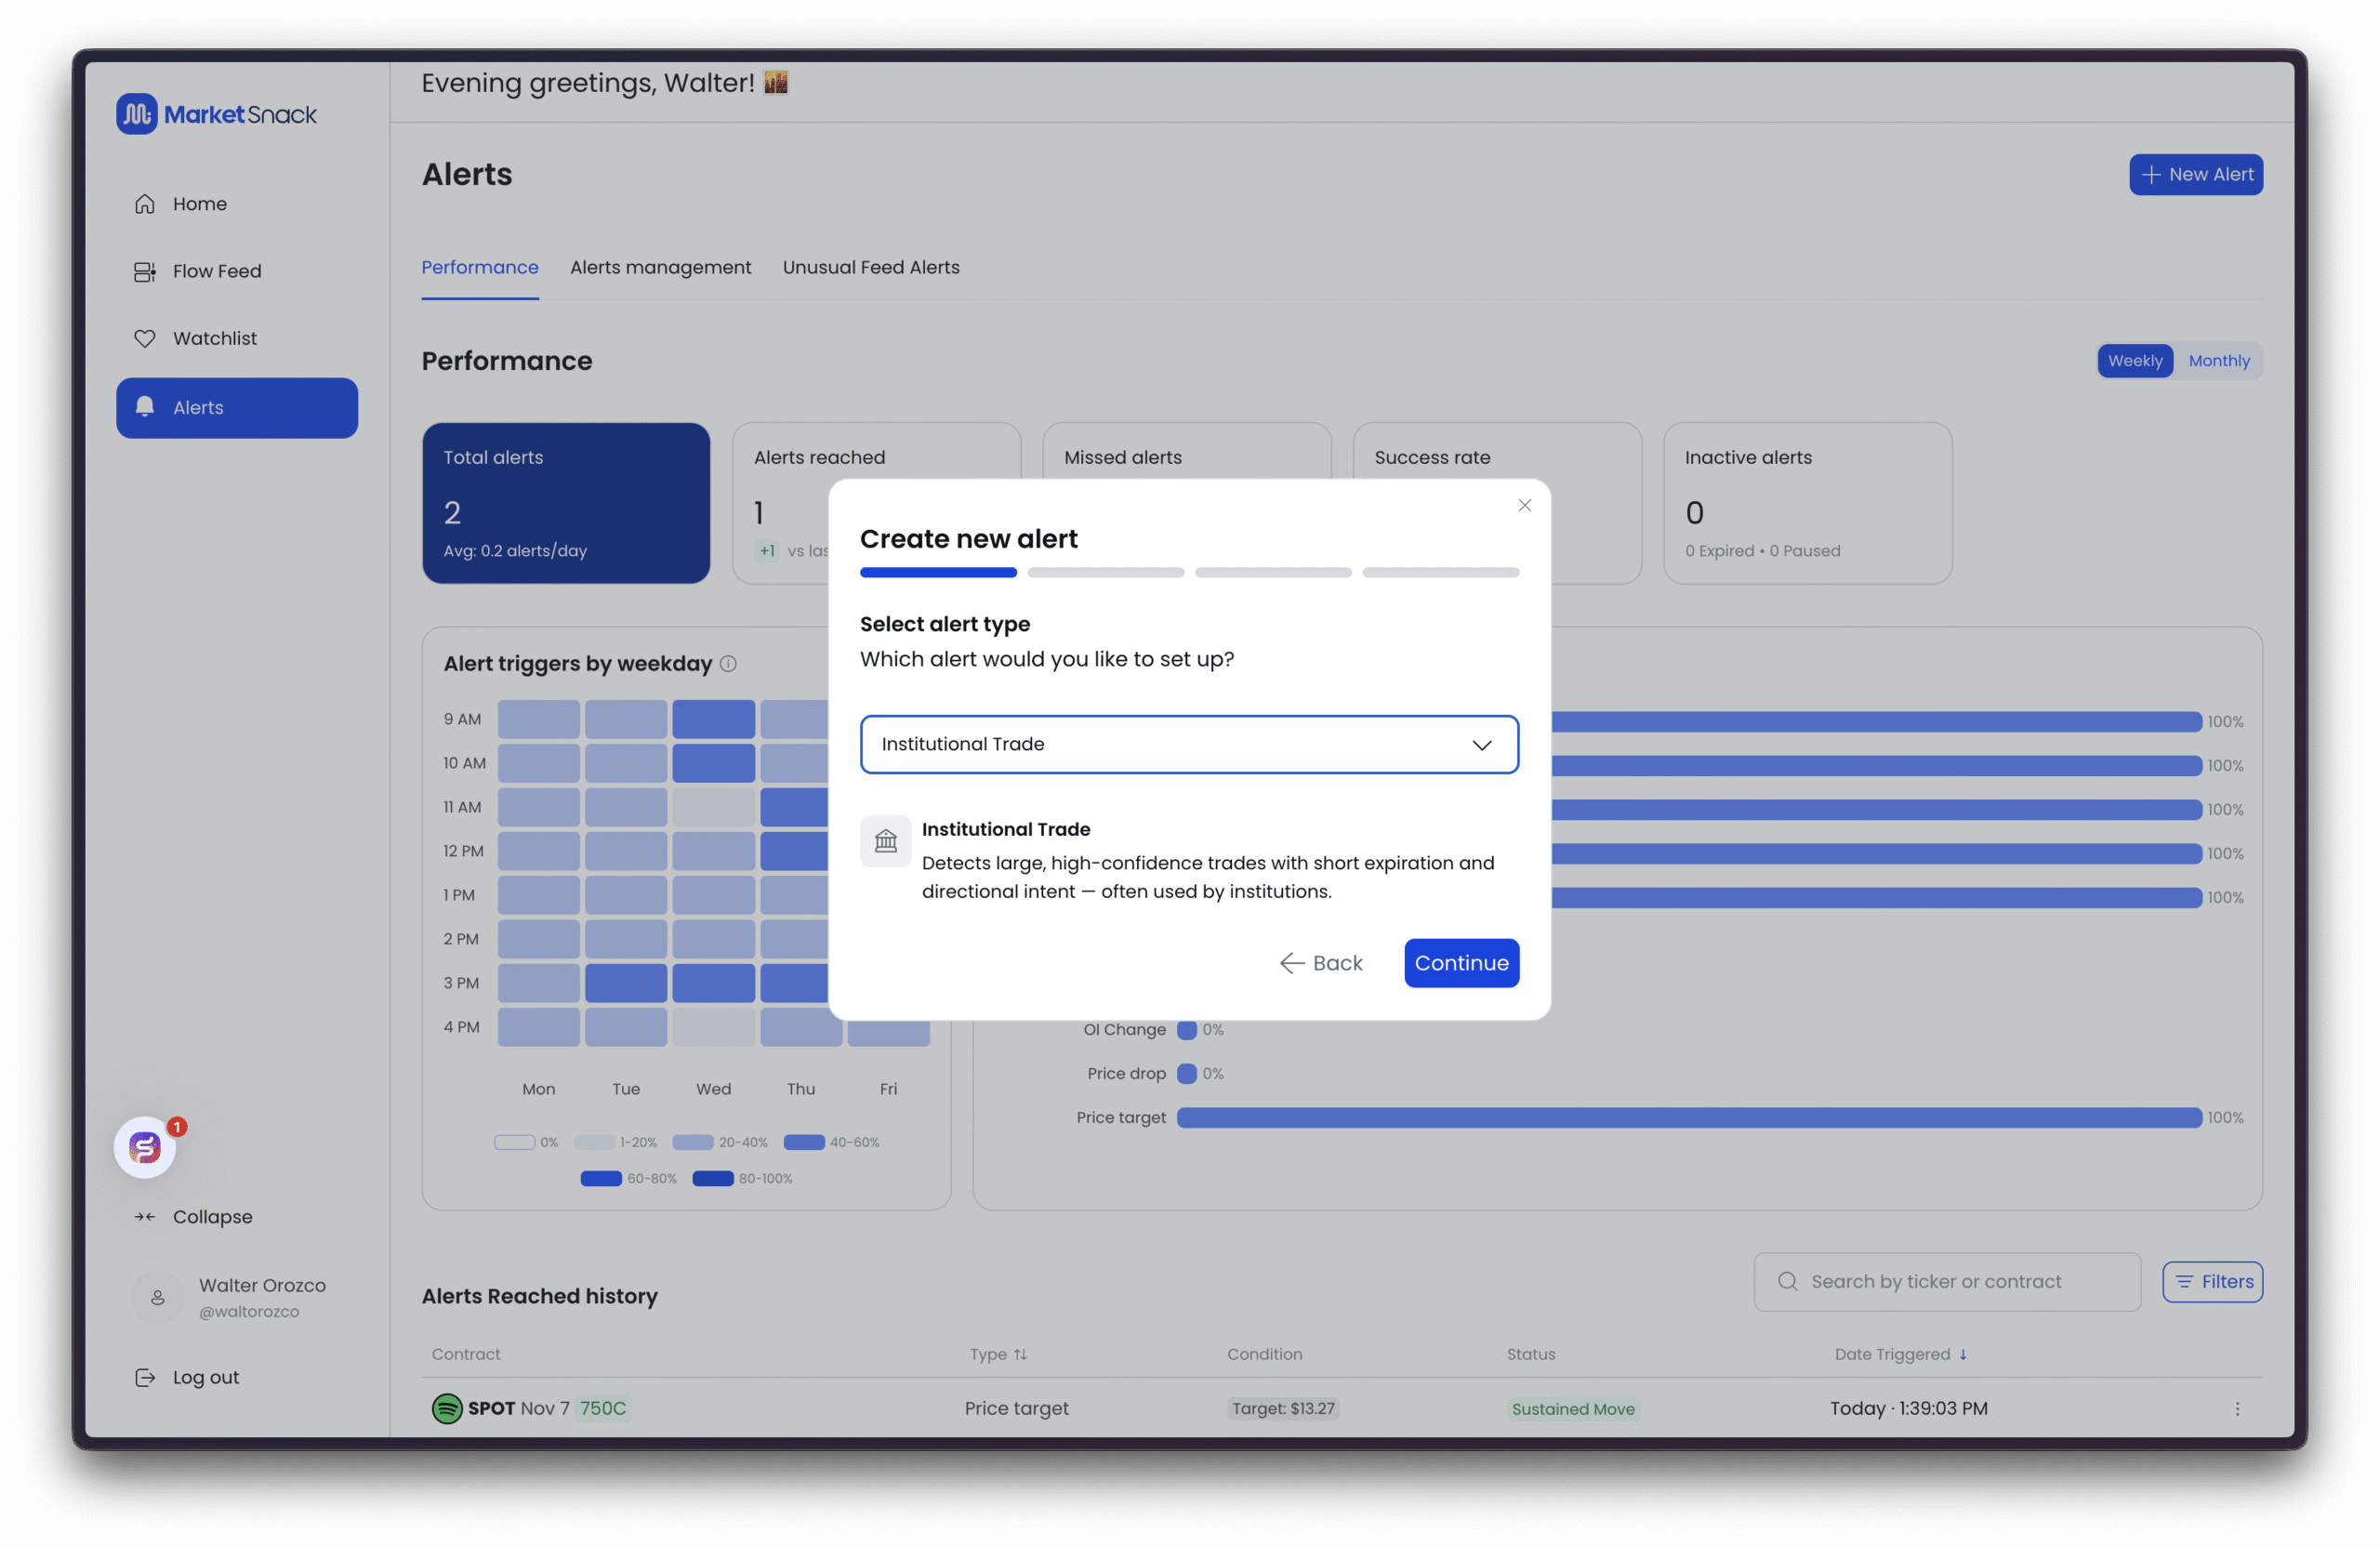
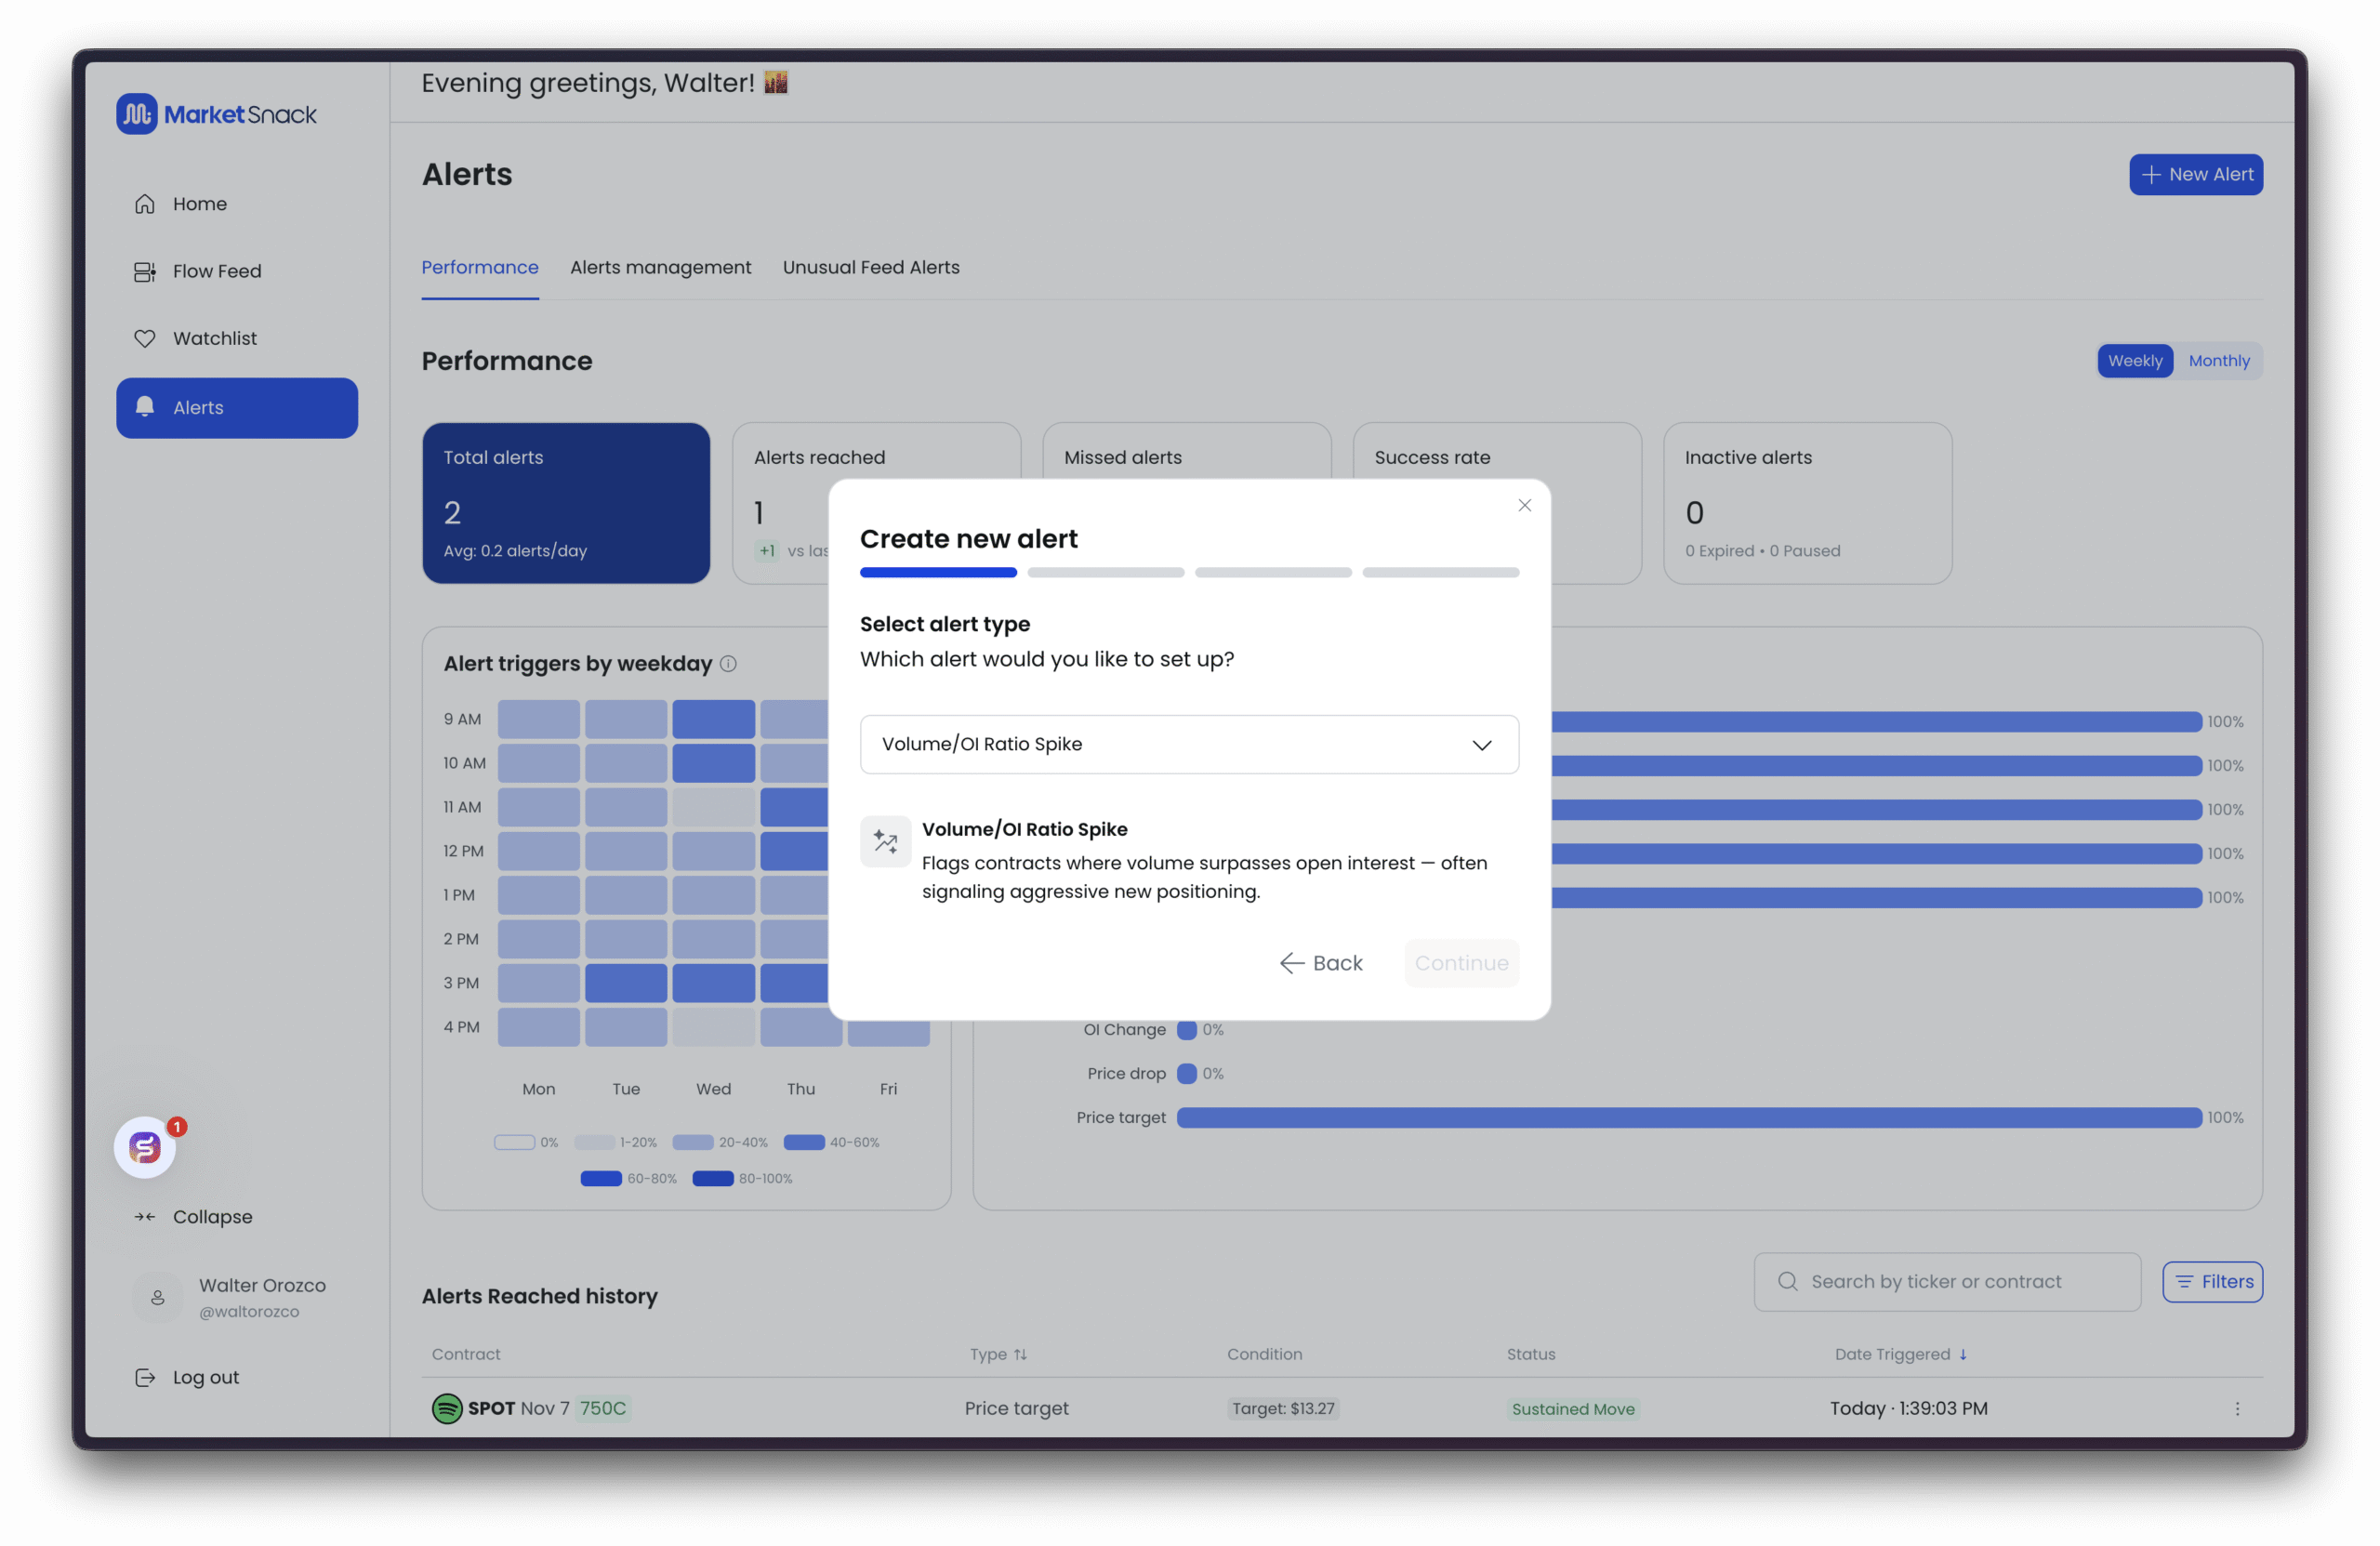
3. Select Alert Type
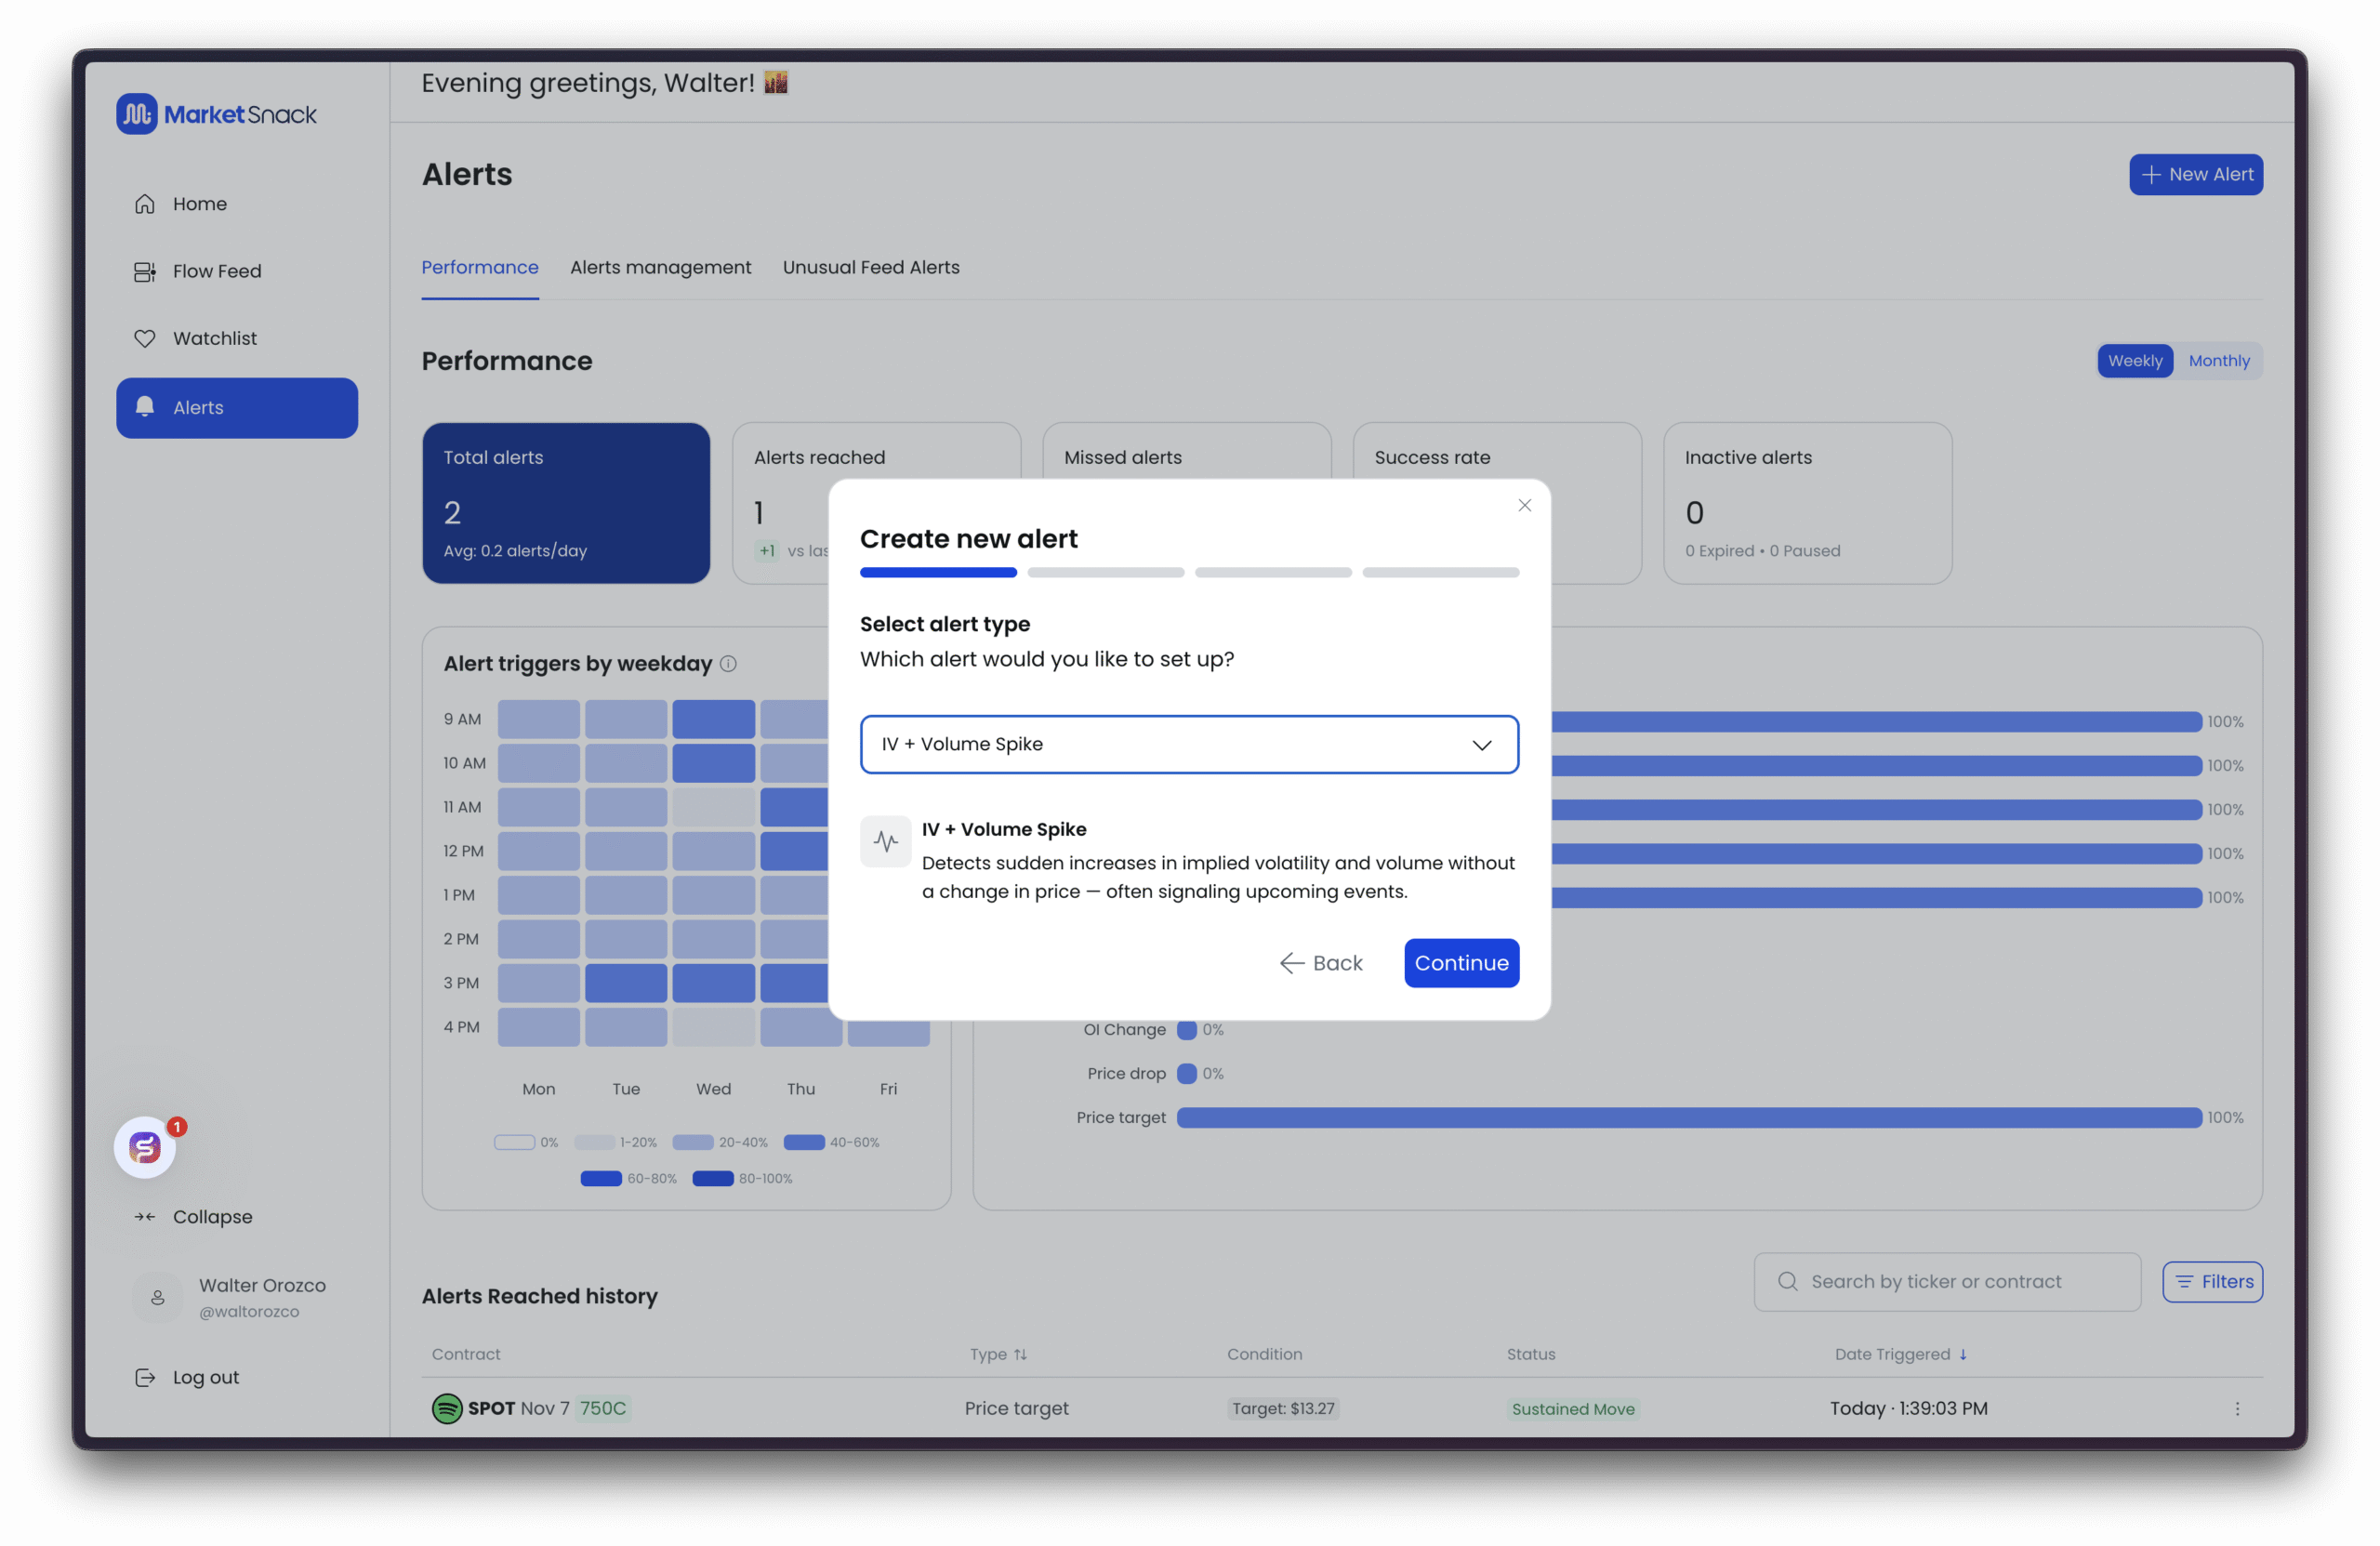
After clicking Continue, choose the type of market signal to monitor:
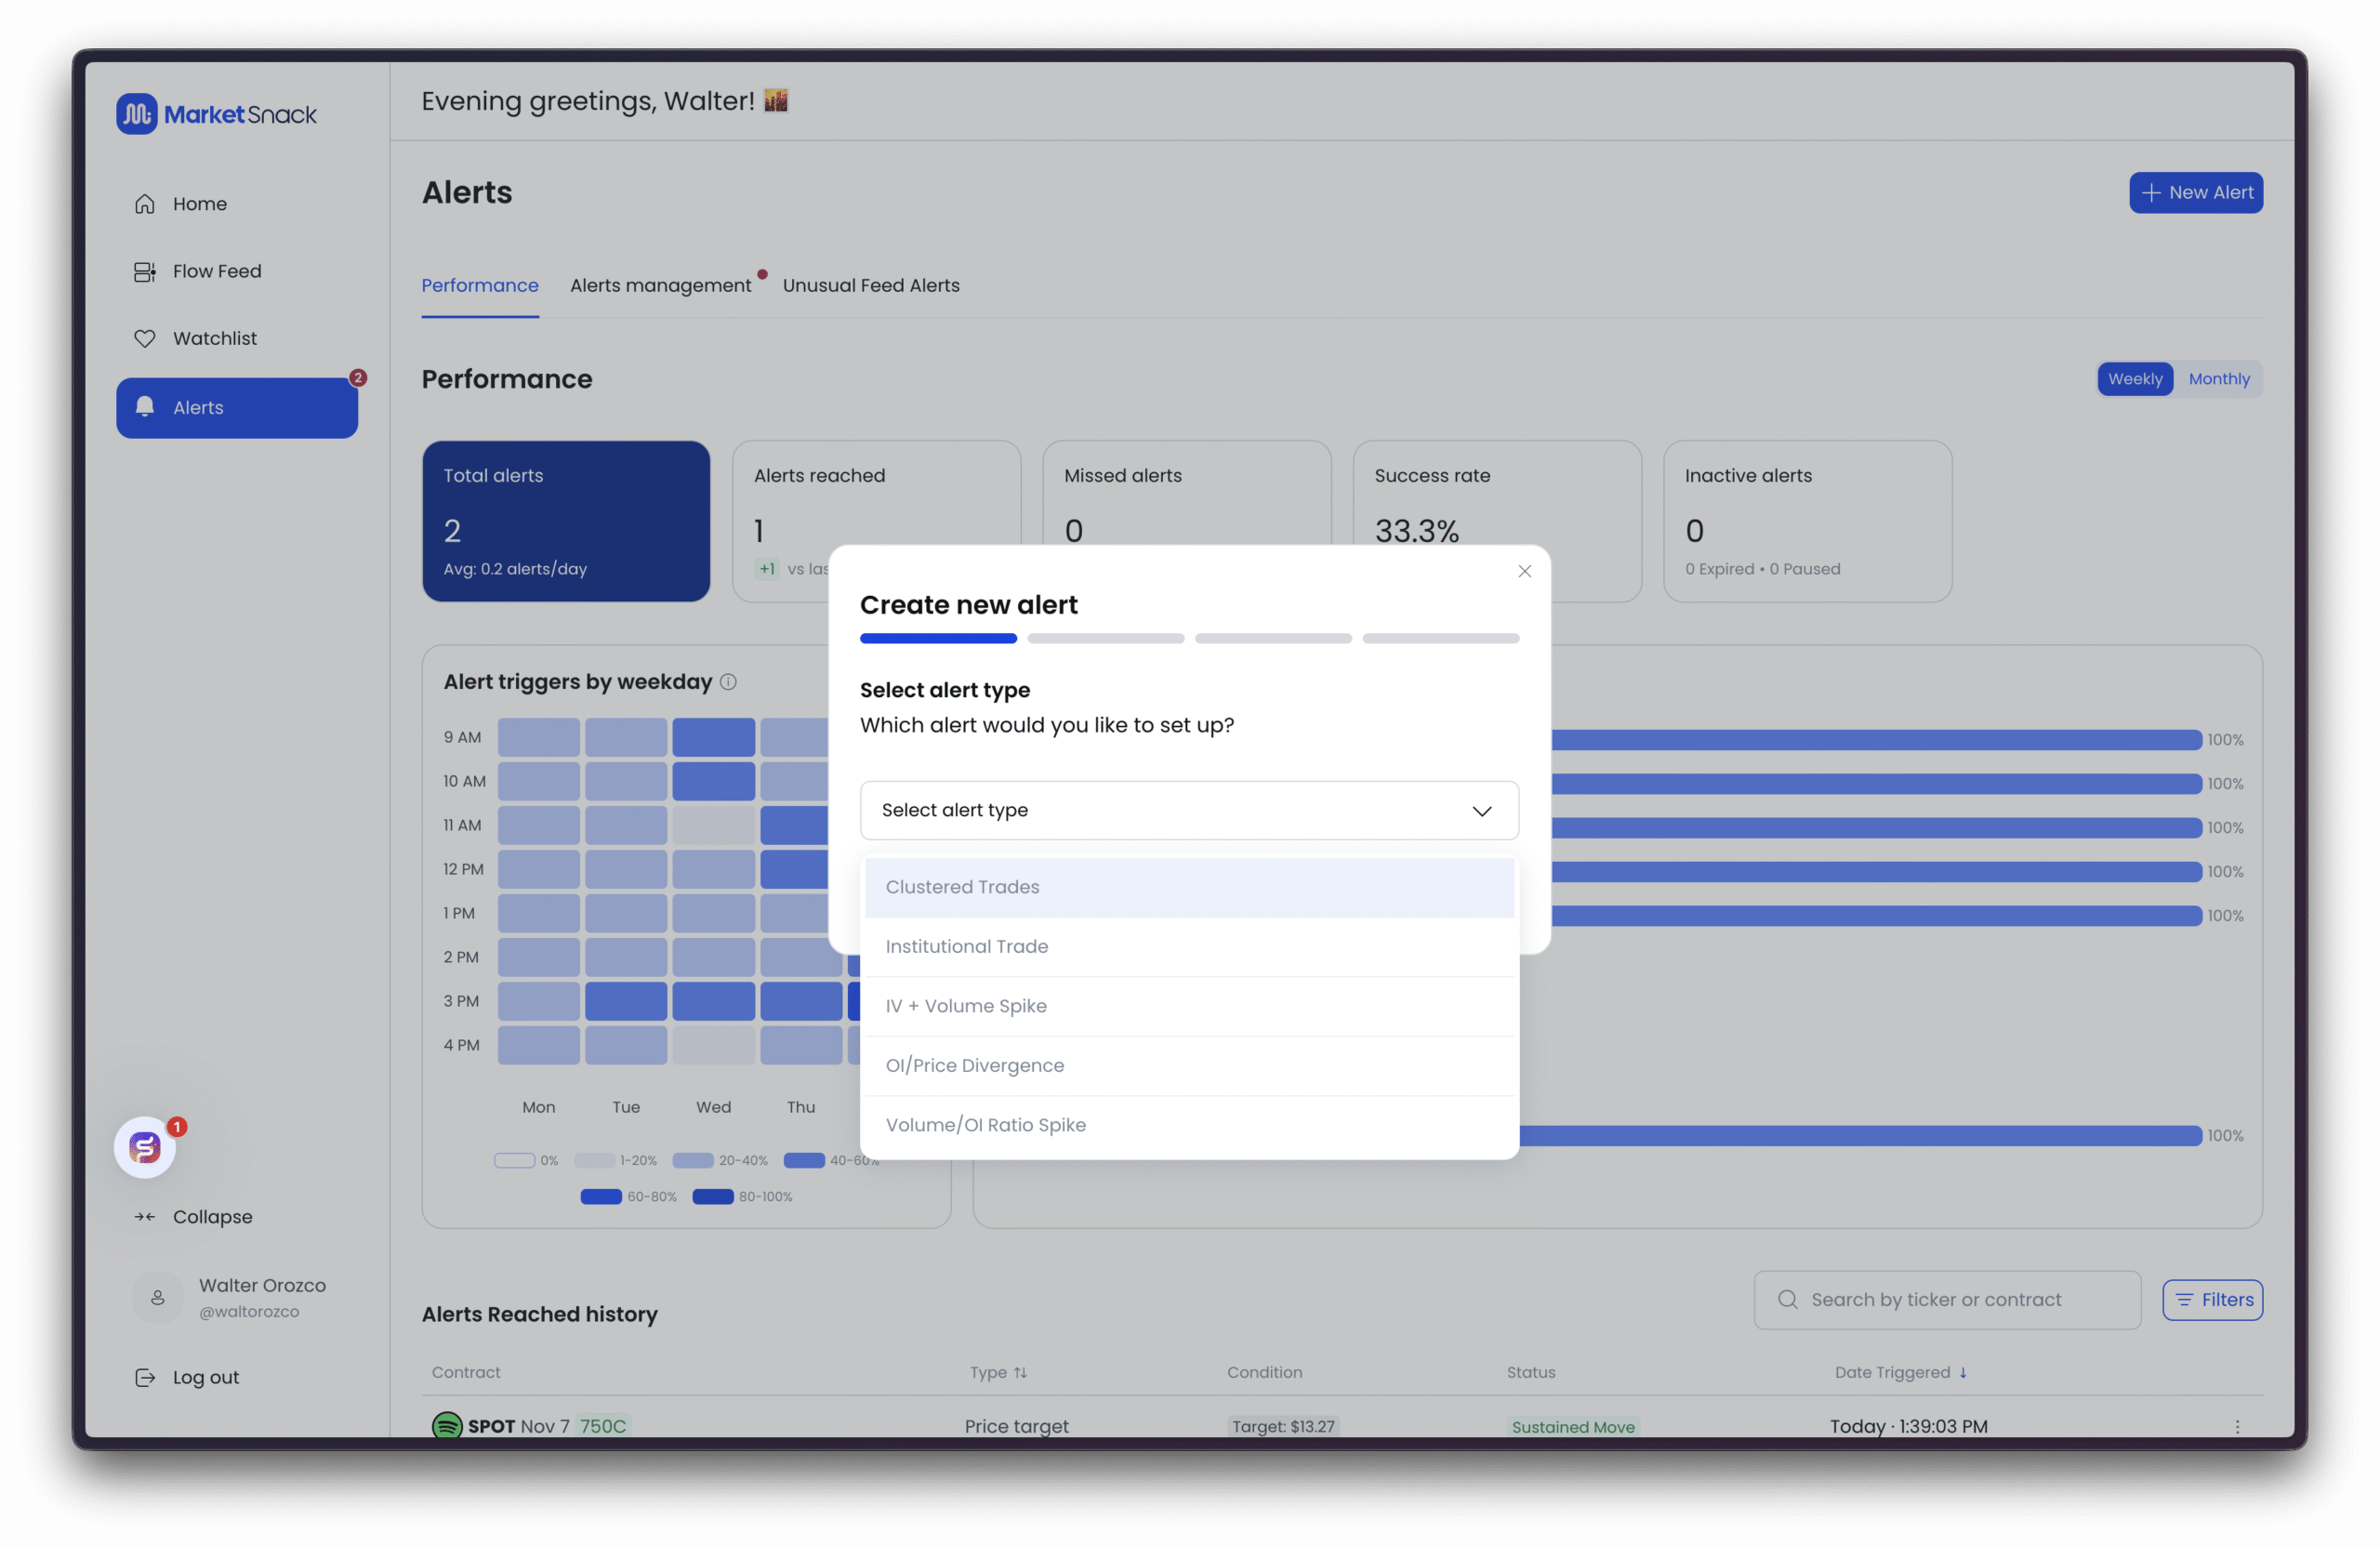
● Clustered Trades – Detects groups of option trades happening almost simultaneously at similar strikes/expirations. Often signals coordinated accumulation or unusual interest.
● Institutional Trade – Flags very large orders, often block or multi-leg trades, typically associated with institutional flows. Good for tracking “smart money.”
● IV + Volume Spike – Triggers when implied volatility (IV) and volume spike together relative to historical baselines. Suggests new information or expectations of strong moves.
● OI/Price Divergence – Highlights divergences between open interest (OI) trends and the underlying asset’s price (e.g., OI rising while price falls). Useful to spot potential continuations or reversals.
● Volume/OI Ratio Spike – Alerts when daily volume far exceeds existing OI (e.g., Vol/OI > 1). Suggests aggressive new position building.
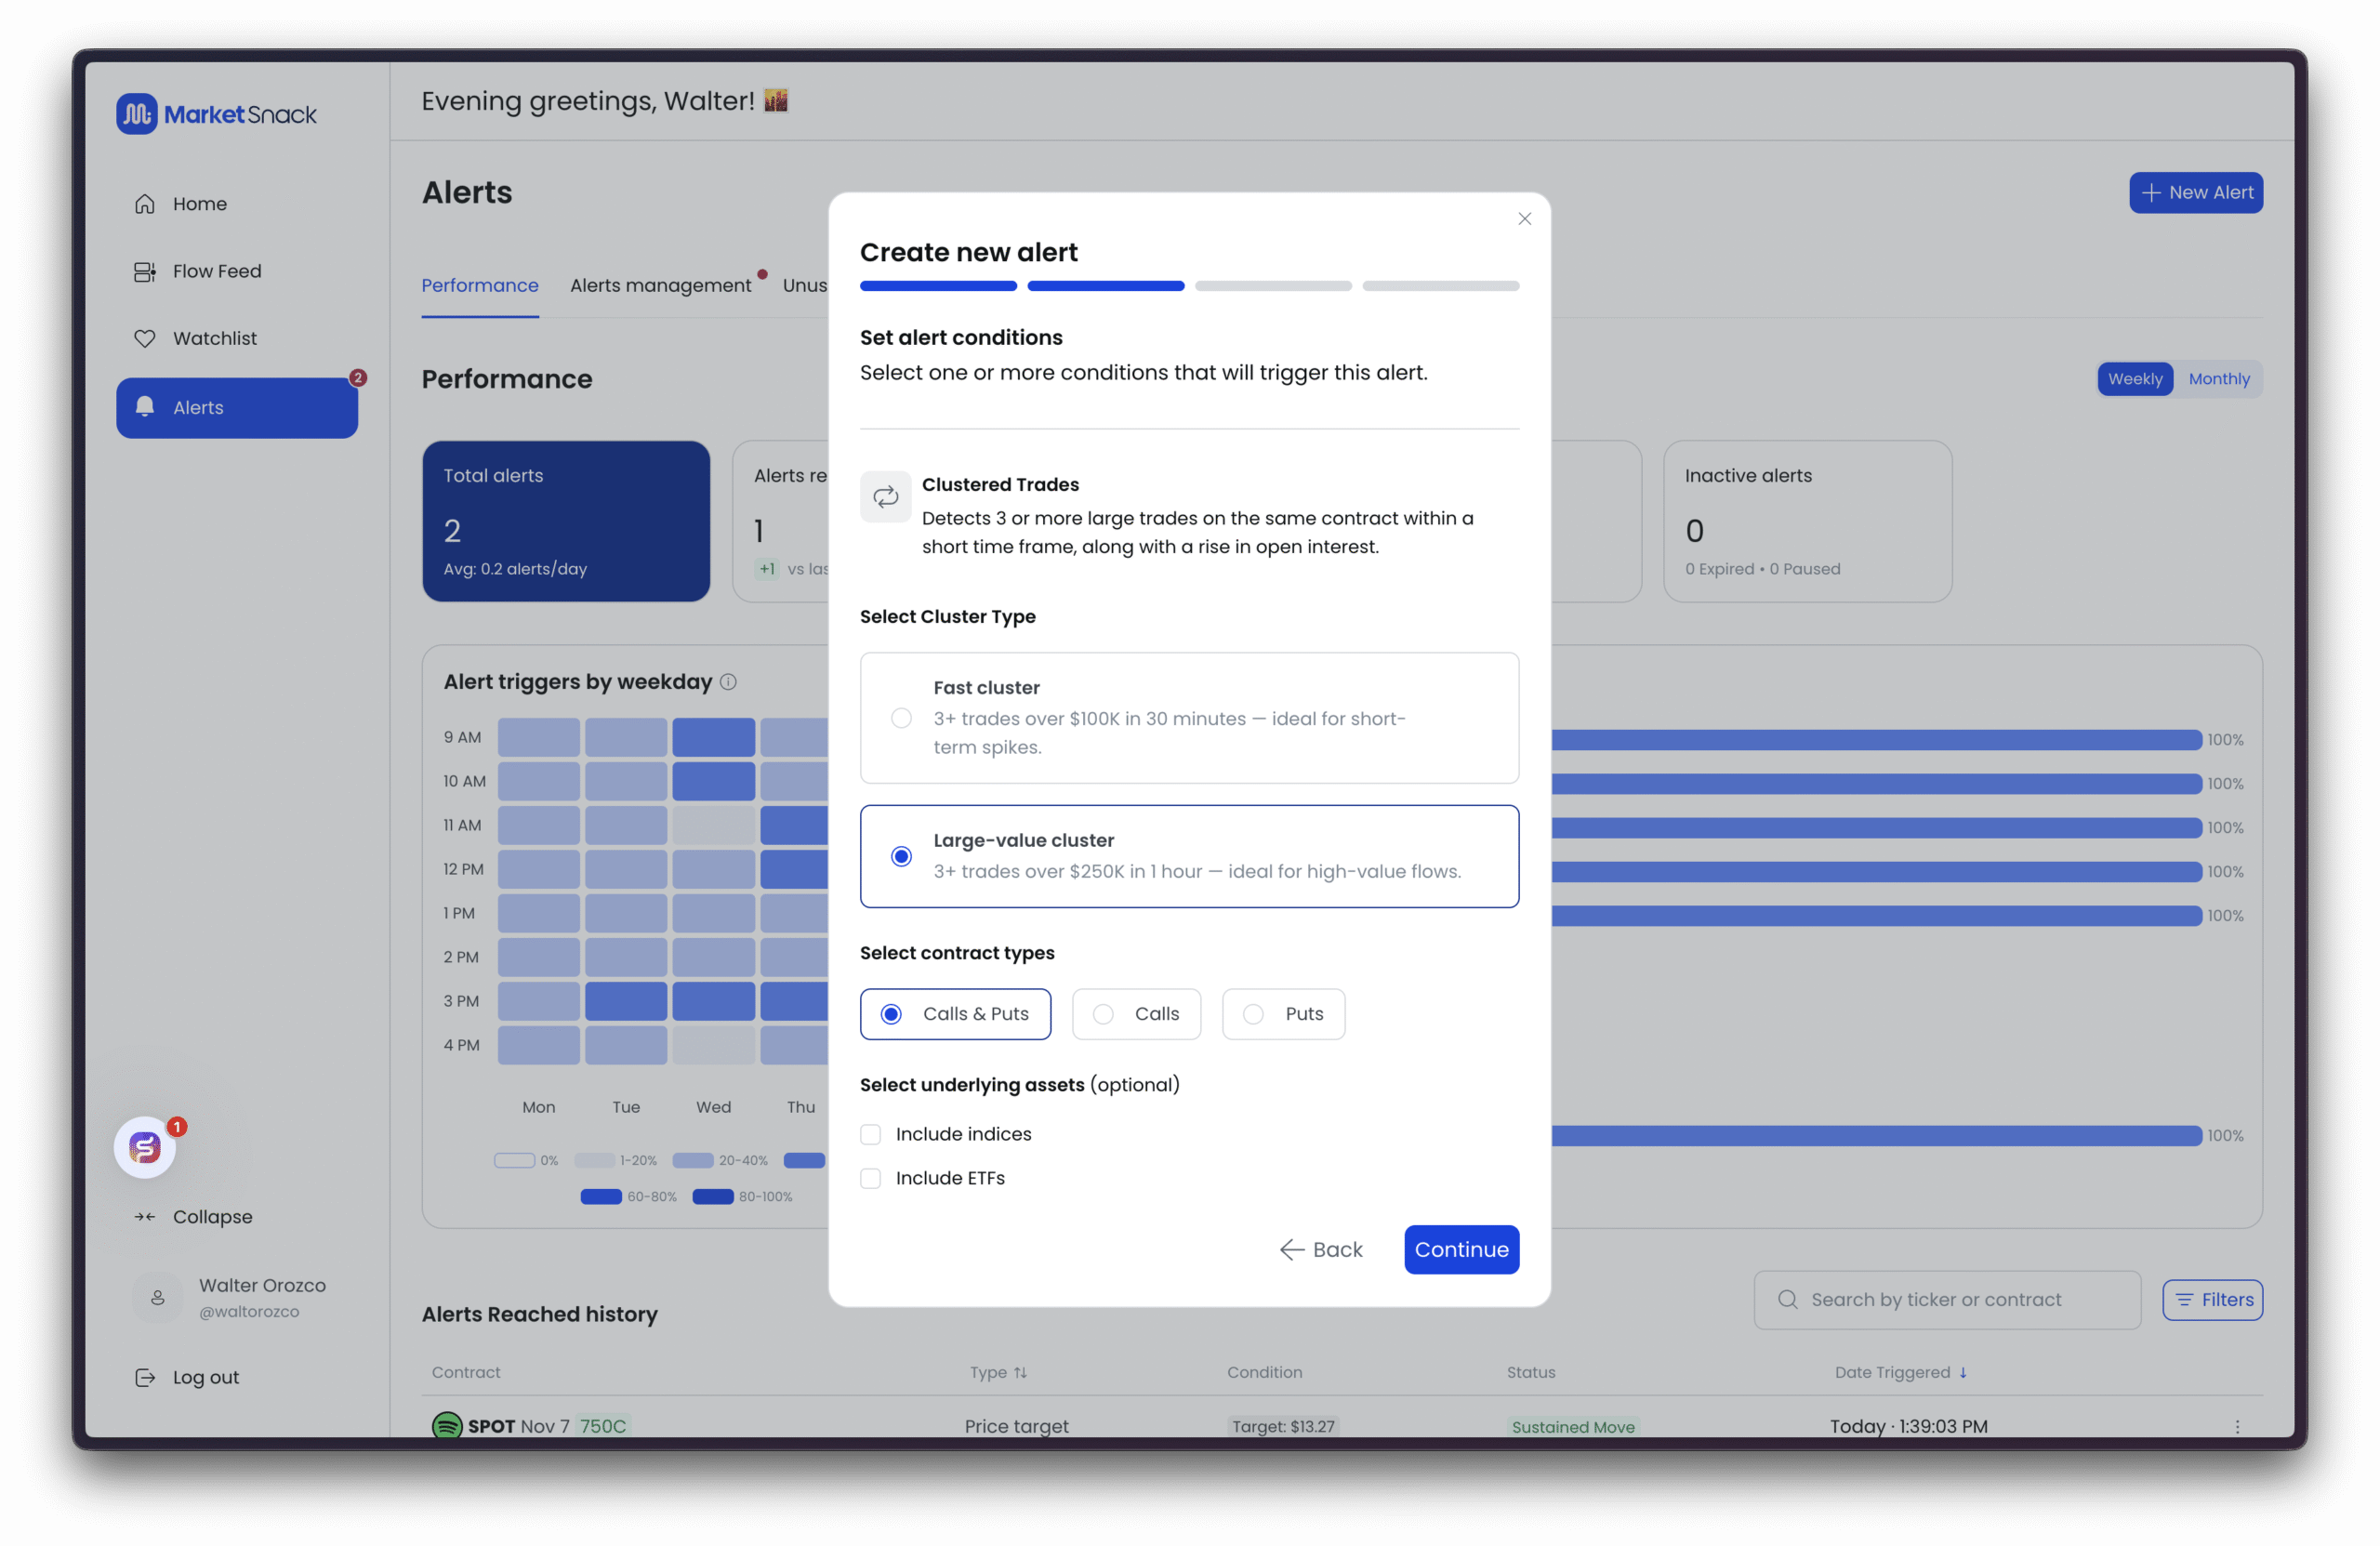
Example: Clustered Trades
When selecting Clustered Trades, configure the following:
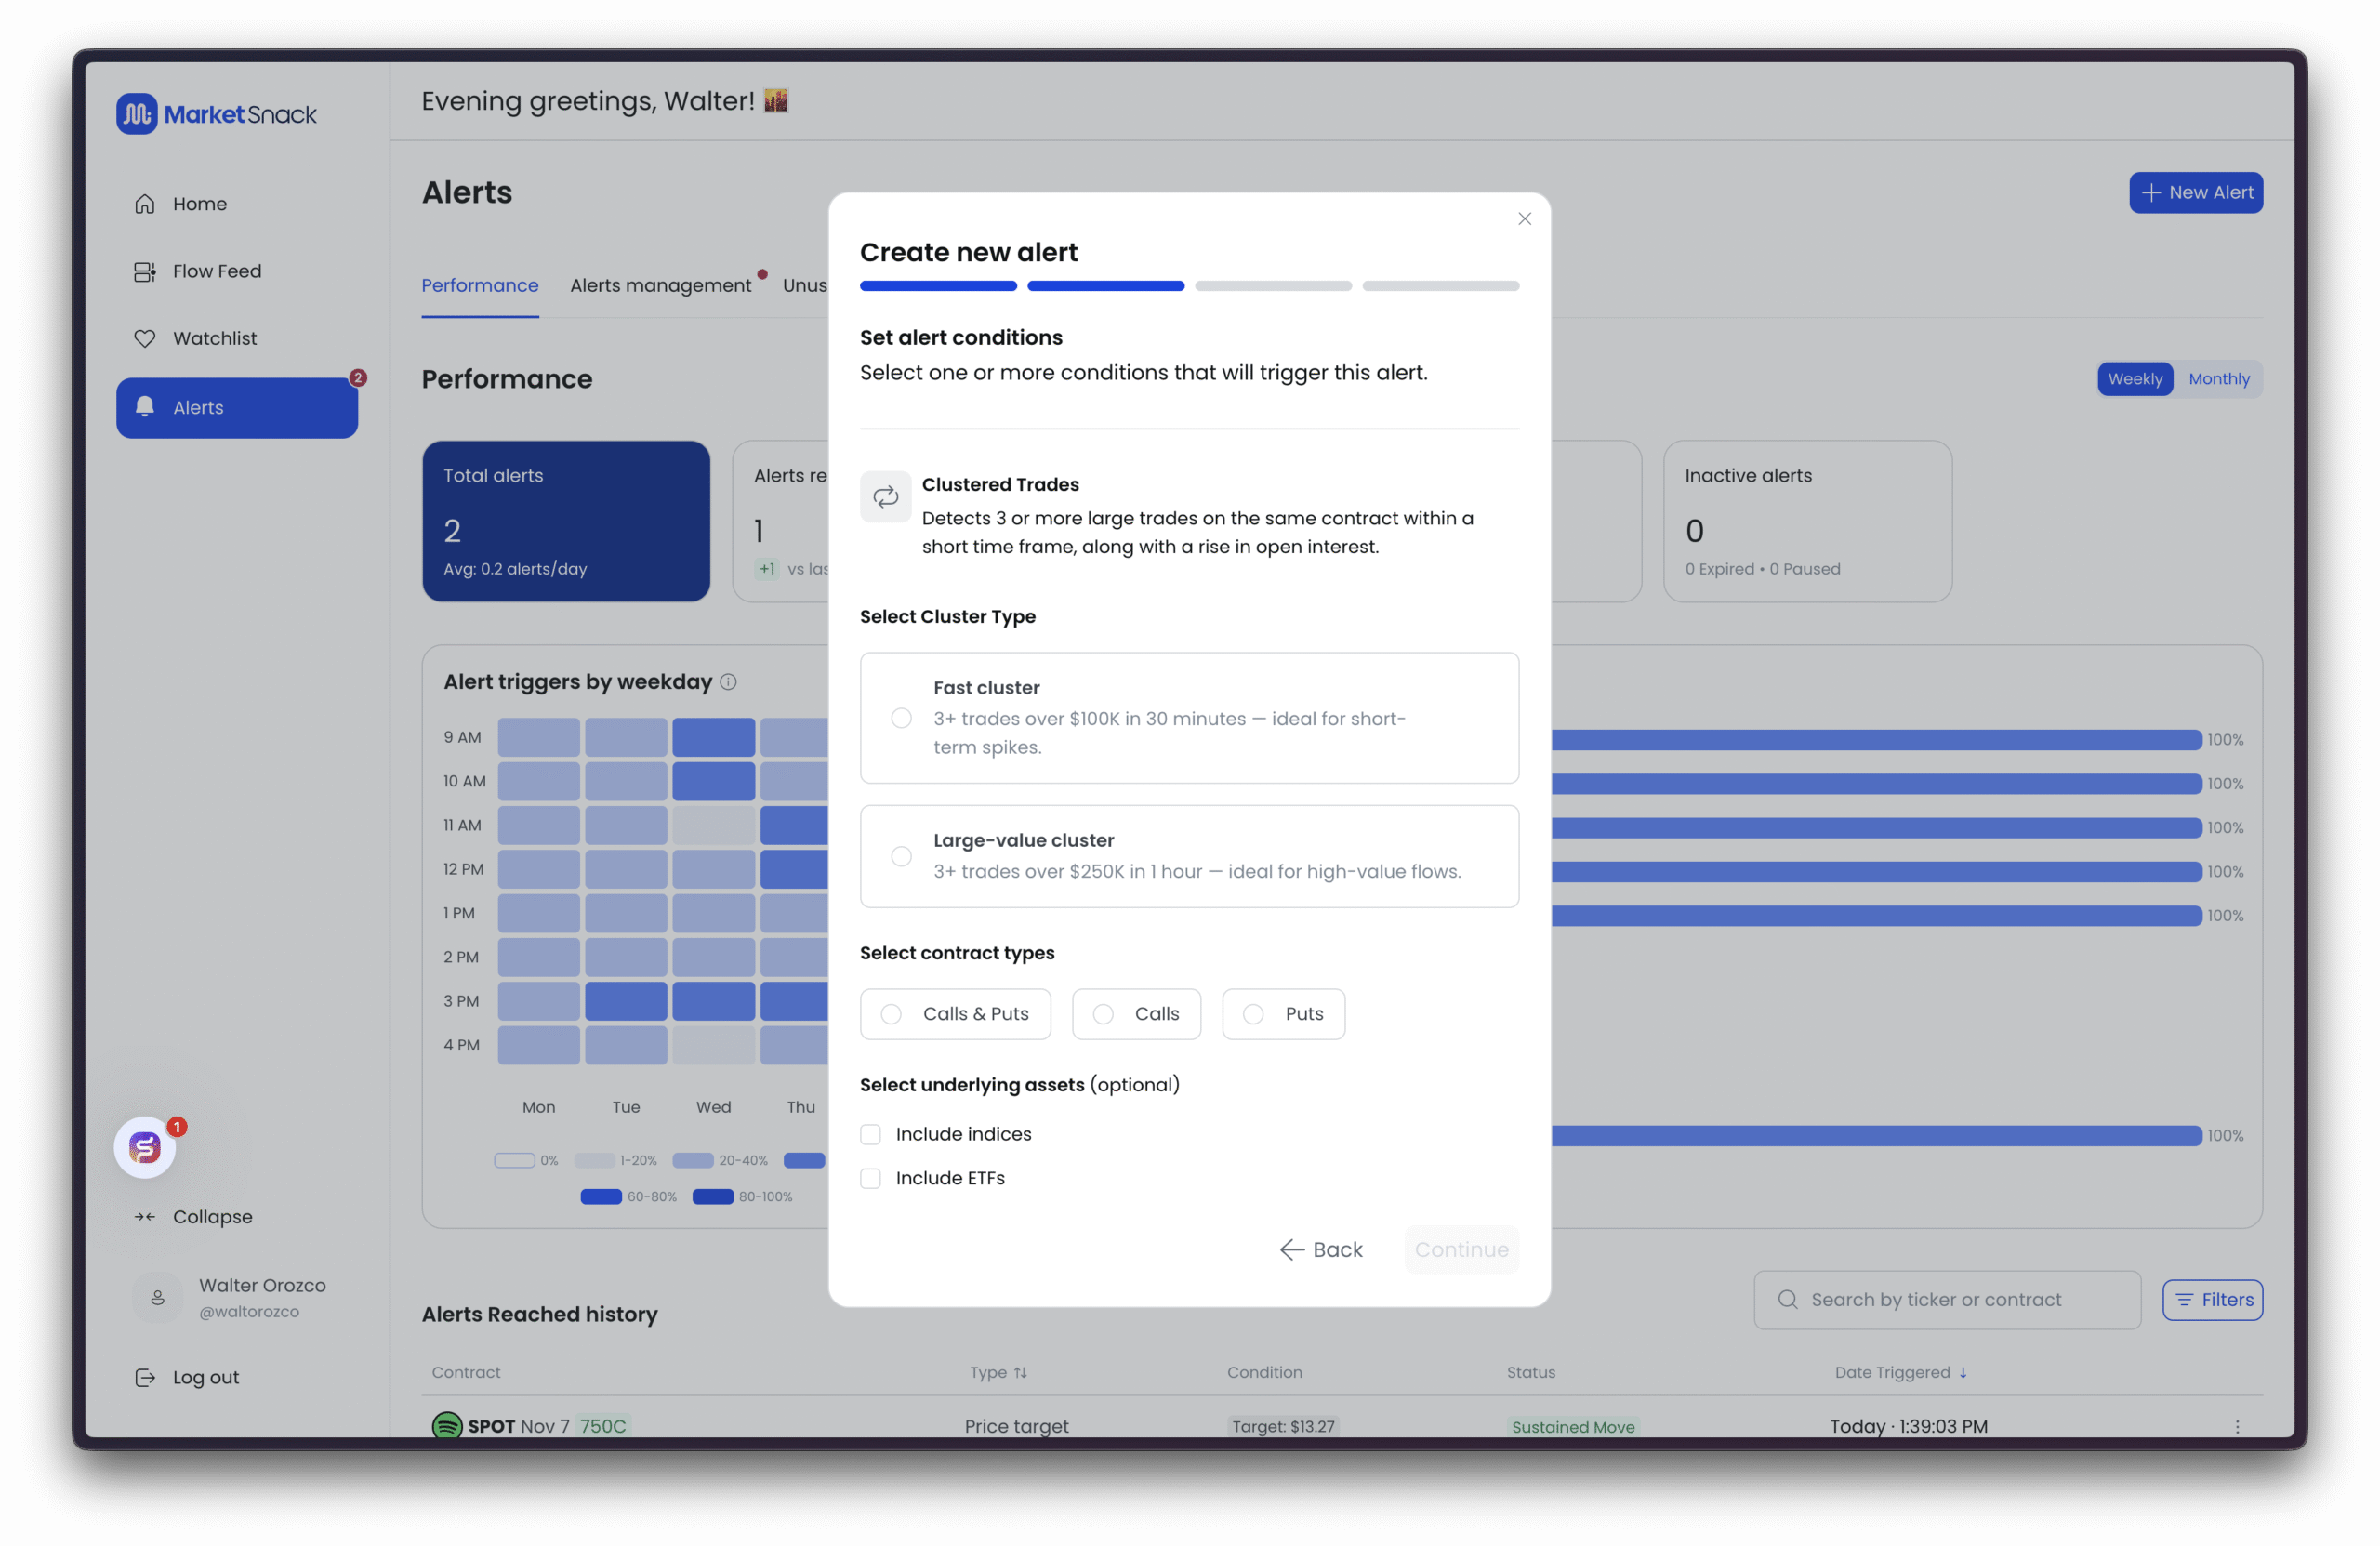
● Cluster Type ○ Fast cluster: 3+ trades > $100K in 30 minutes. Captures intraday bursts and momentum.
○ Large-value cluster: 3+ trades > $250K in 1 hour. Focused on high-value flows (likely institutional) with less noise.
● Contract Types ○ Calls & Puts, Calls only, or Puts only.
● Underlying Assets (optional) ○ Include indices (e.g., SPX, NDX): Adds market-wide signals; may increase the number of alerts.
○ Include ETFs (e.g., SPY, QQQ): Useful for detecting aggregated flows or hedging through baskets.
Tip: Use Fast cluster for intraday ignition signals, and Large-value cluster for large-ticket flows. Combine with Calls/Puts to align with your directional bias. Suppose you want to detect high-value flows without having a directional bias. In this case, select the Large-value cluster option and choose Calls & Puts.
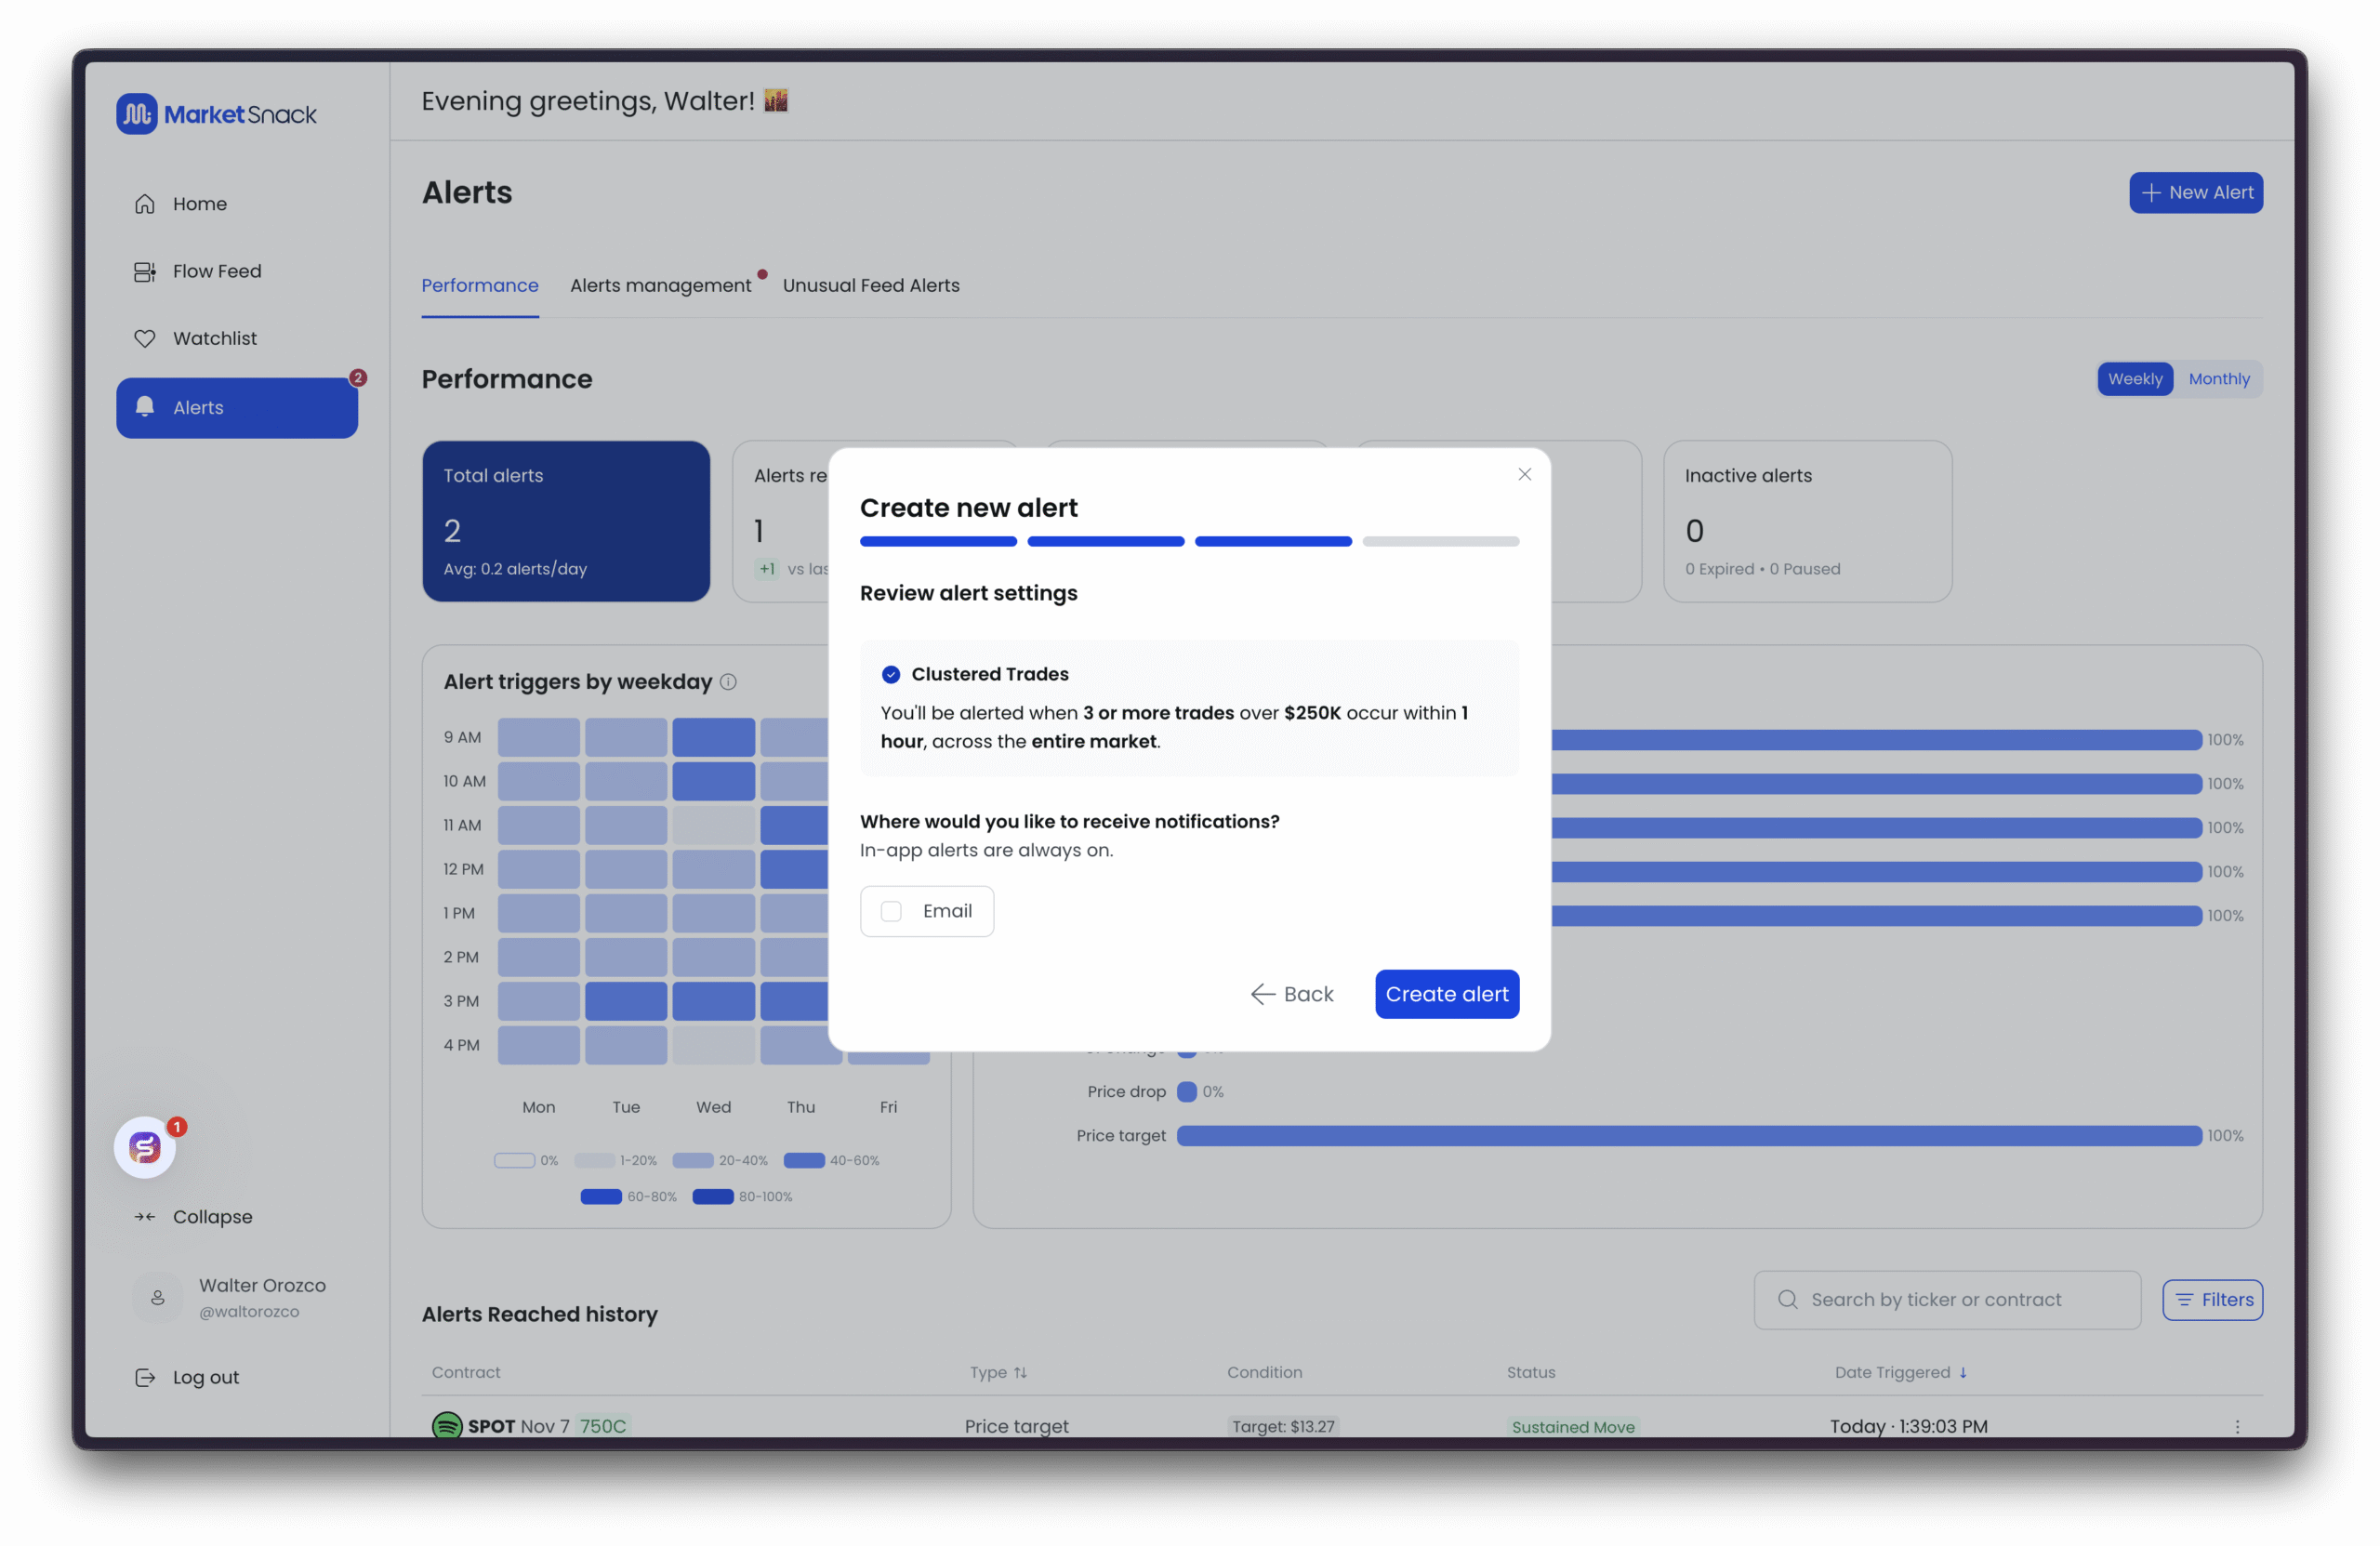
After pressing Continue, MarketSnack will confirm that once the alert conditions are met, you will be notified directly in the application. You will also have the option to receive notifications via email or SMS.
● In-app notifications – Unlimited.
● Email notifications – Unlimited.
● SMS notifications – Limited by system quota.
These notification rules apply to all types of alerts across the platform.
Once you press Create Alert, it will appear under Alerts Management along with all other alerts you have created. MarketSnack allows you to manage multiple alerts at the same time, so you can set up different rules that align with your various trading strategies.
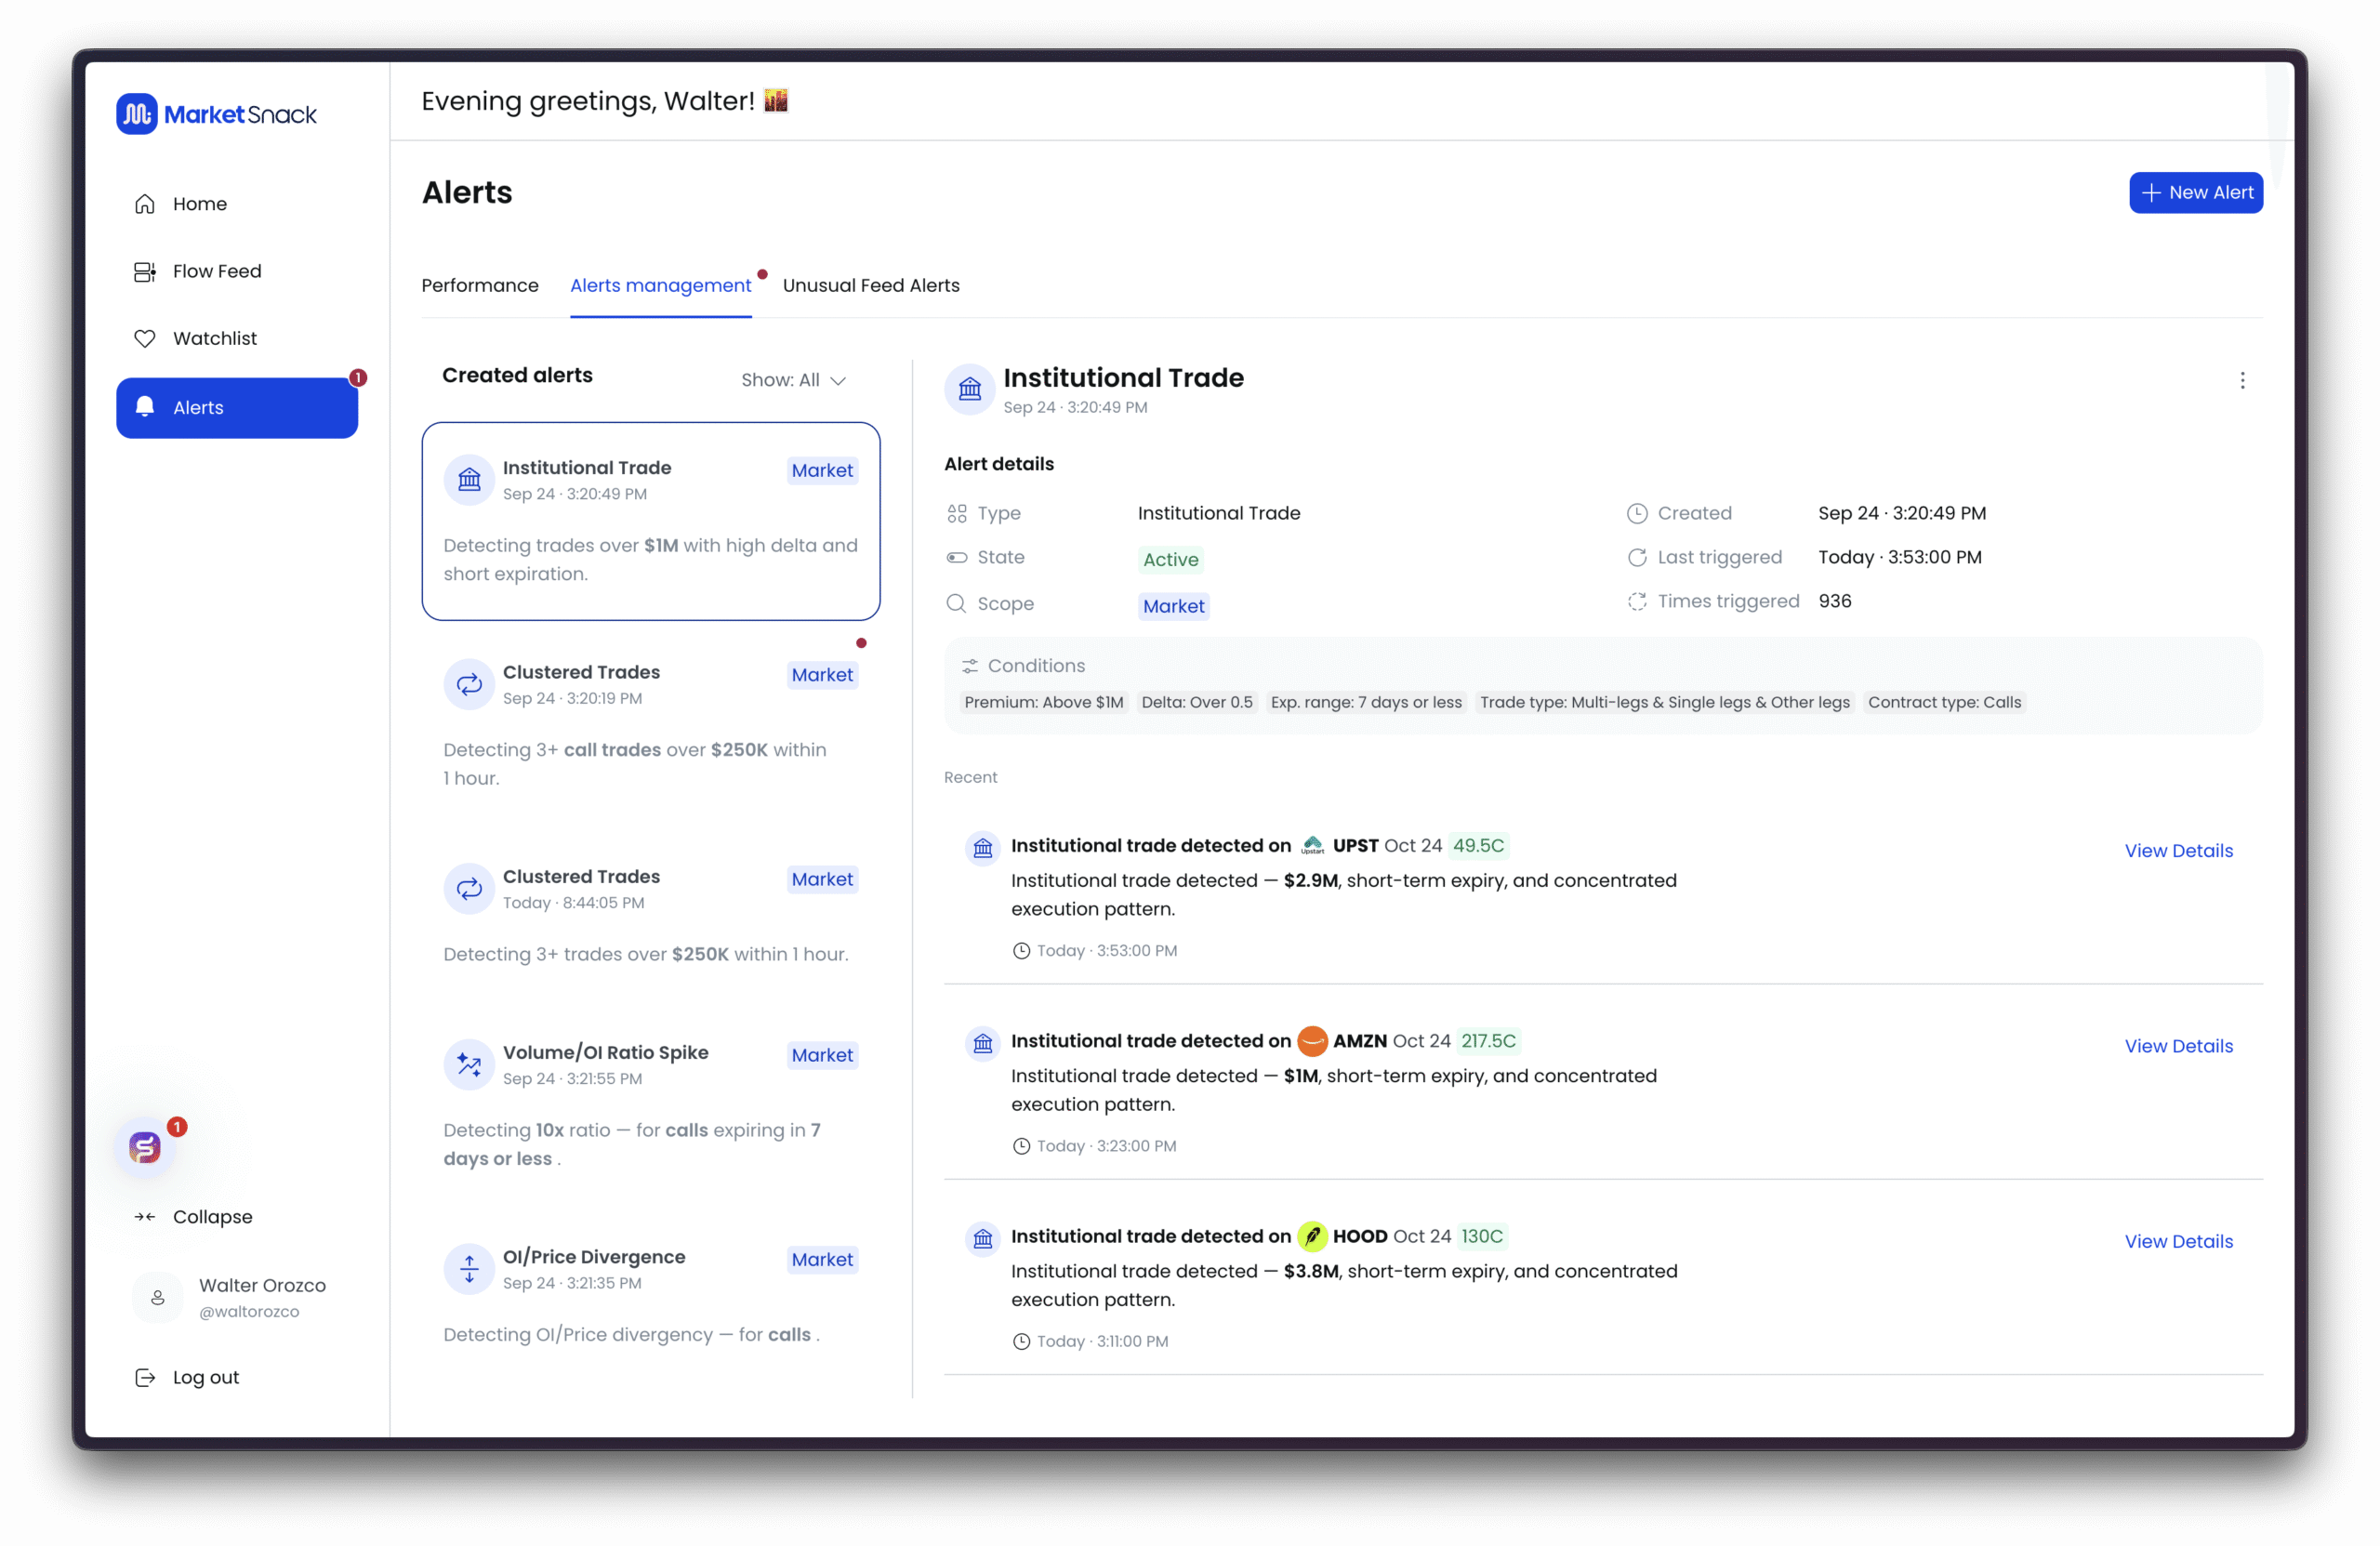
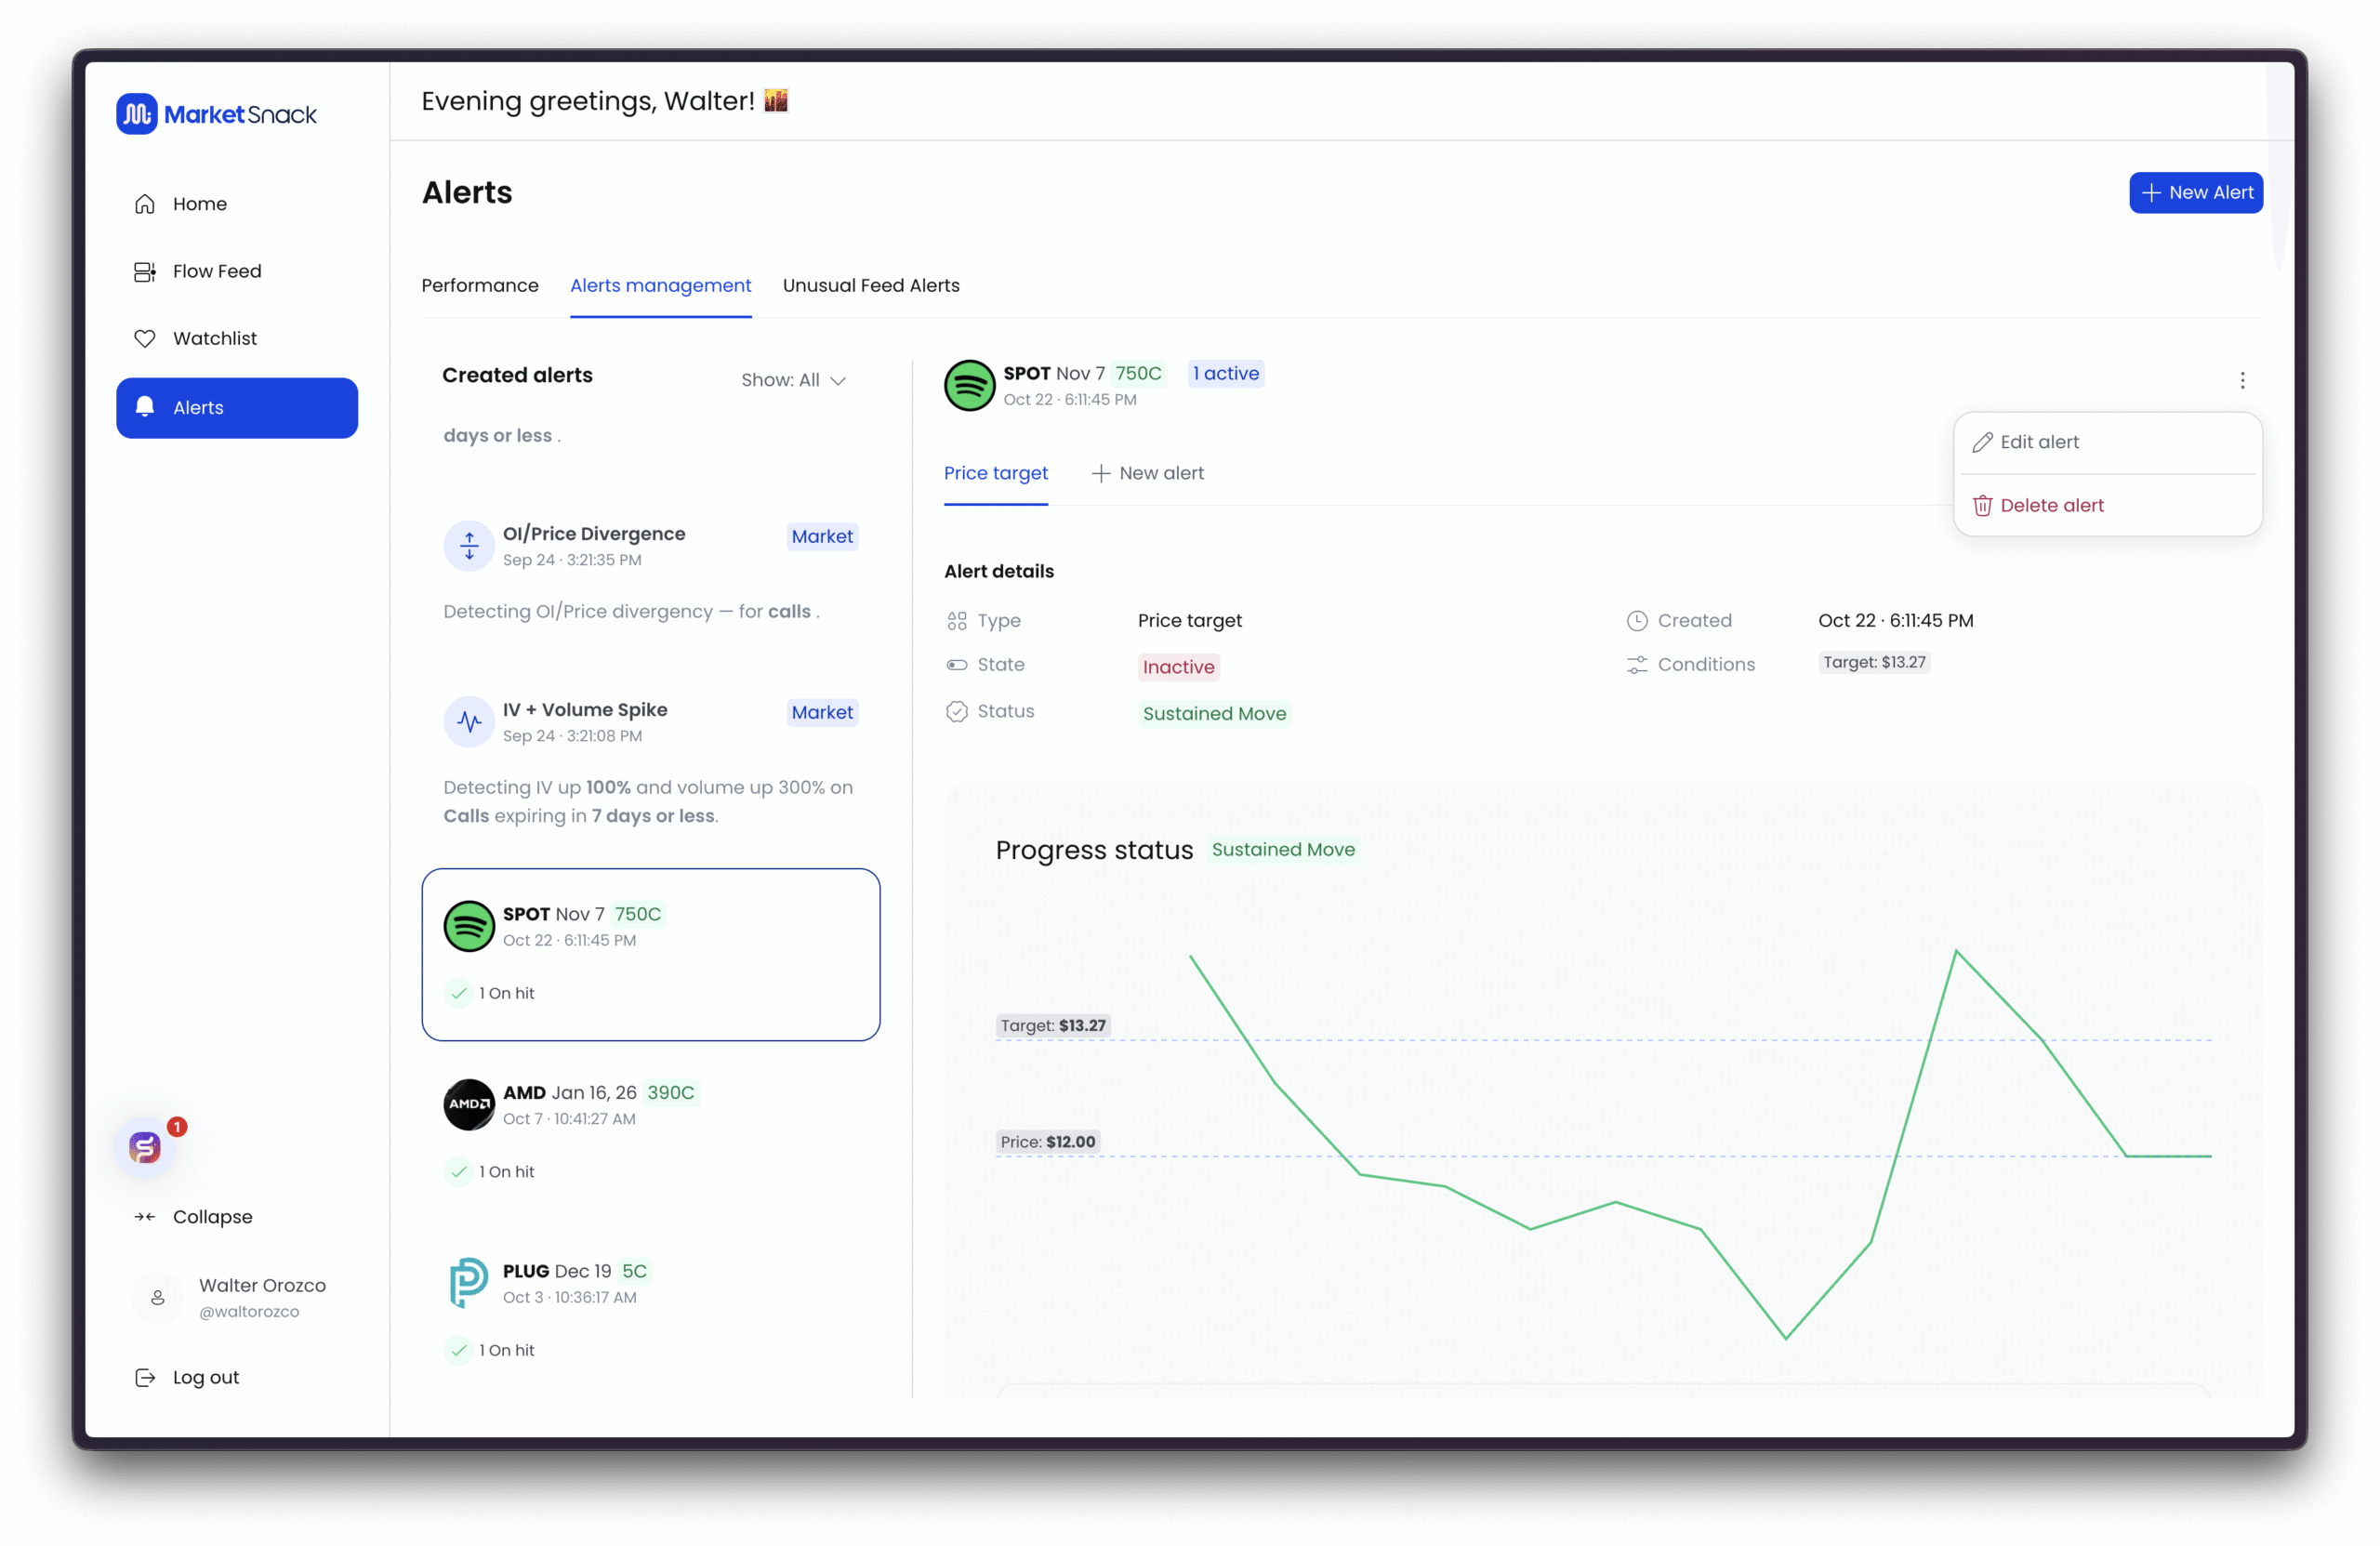
Viewing Alerts in Real Time
All active alerts will automatically appear under Alerts Management as MarketSnack detects them in real time. From here, you can track status, see trigger details, and access further information with a single click.
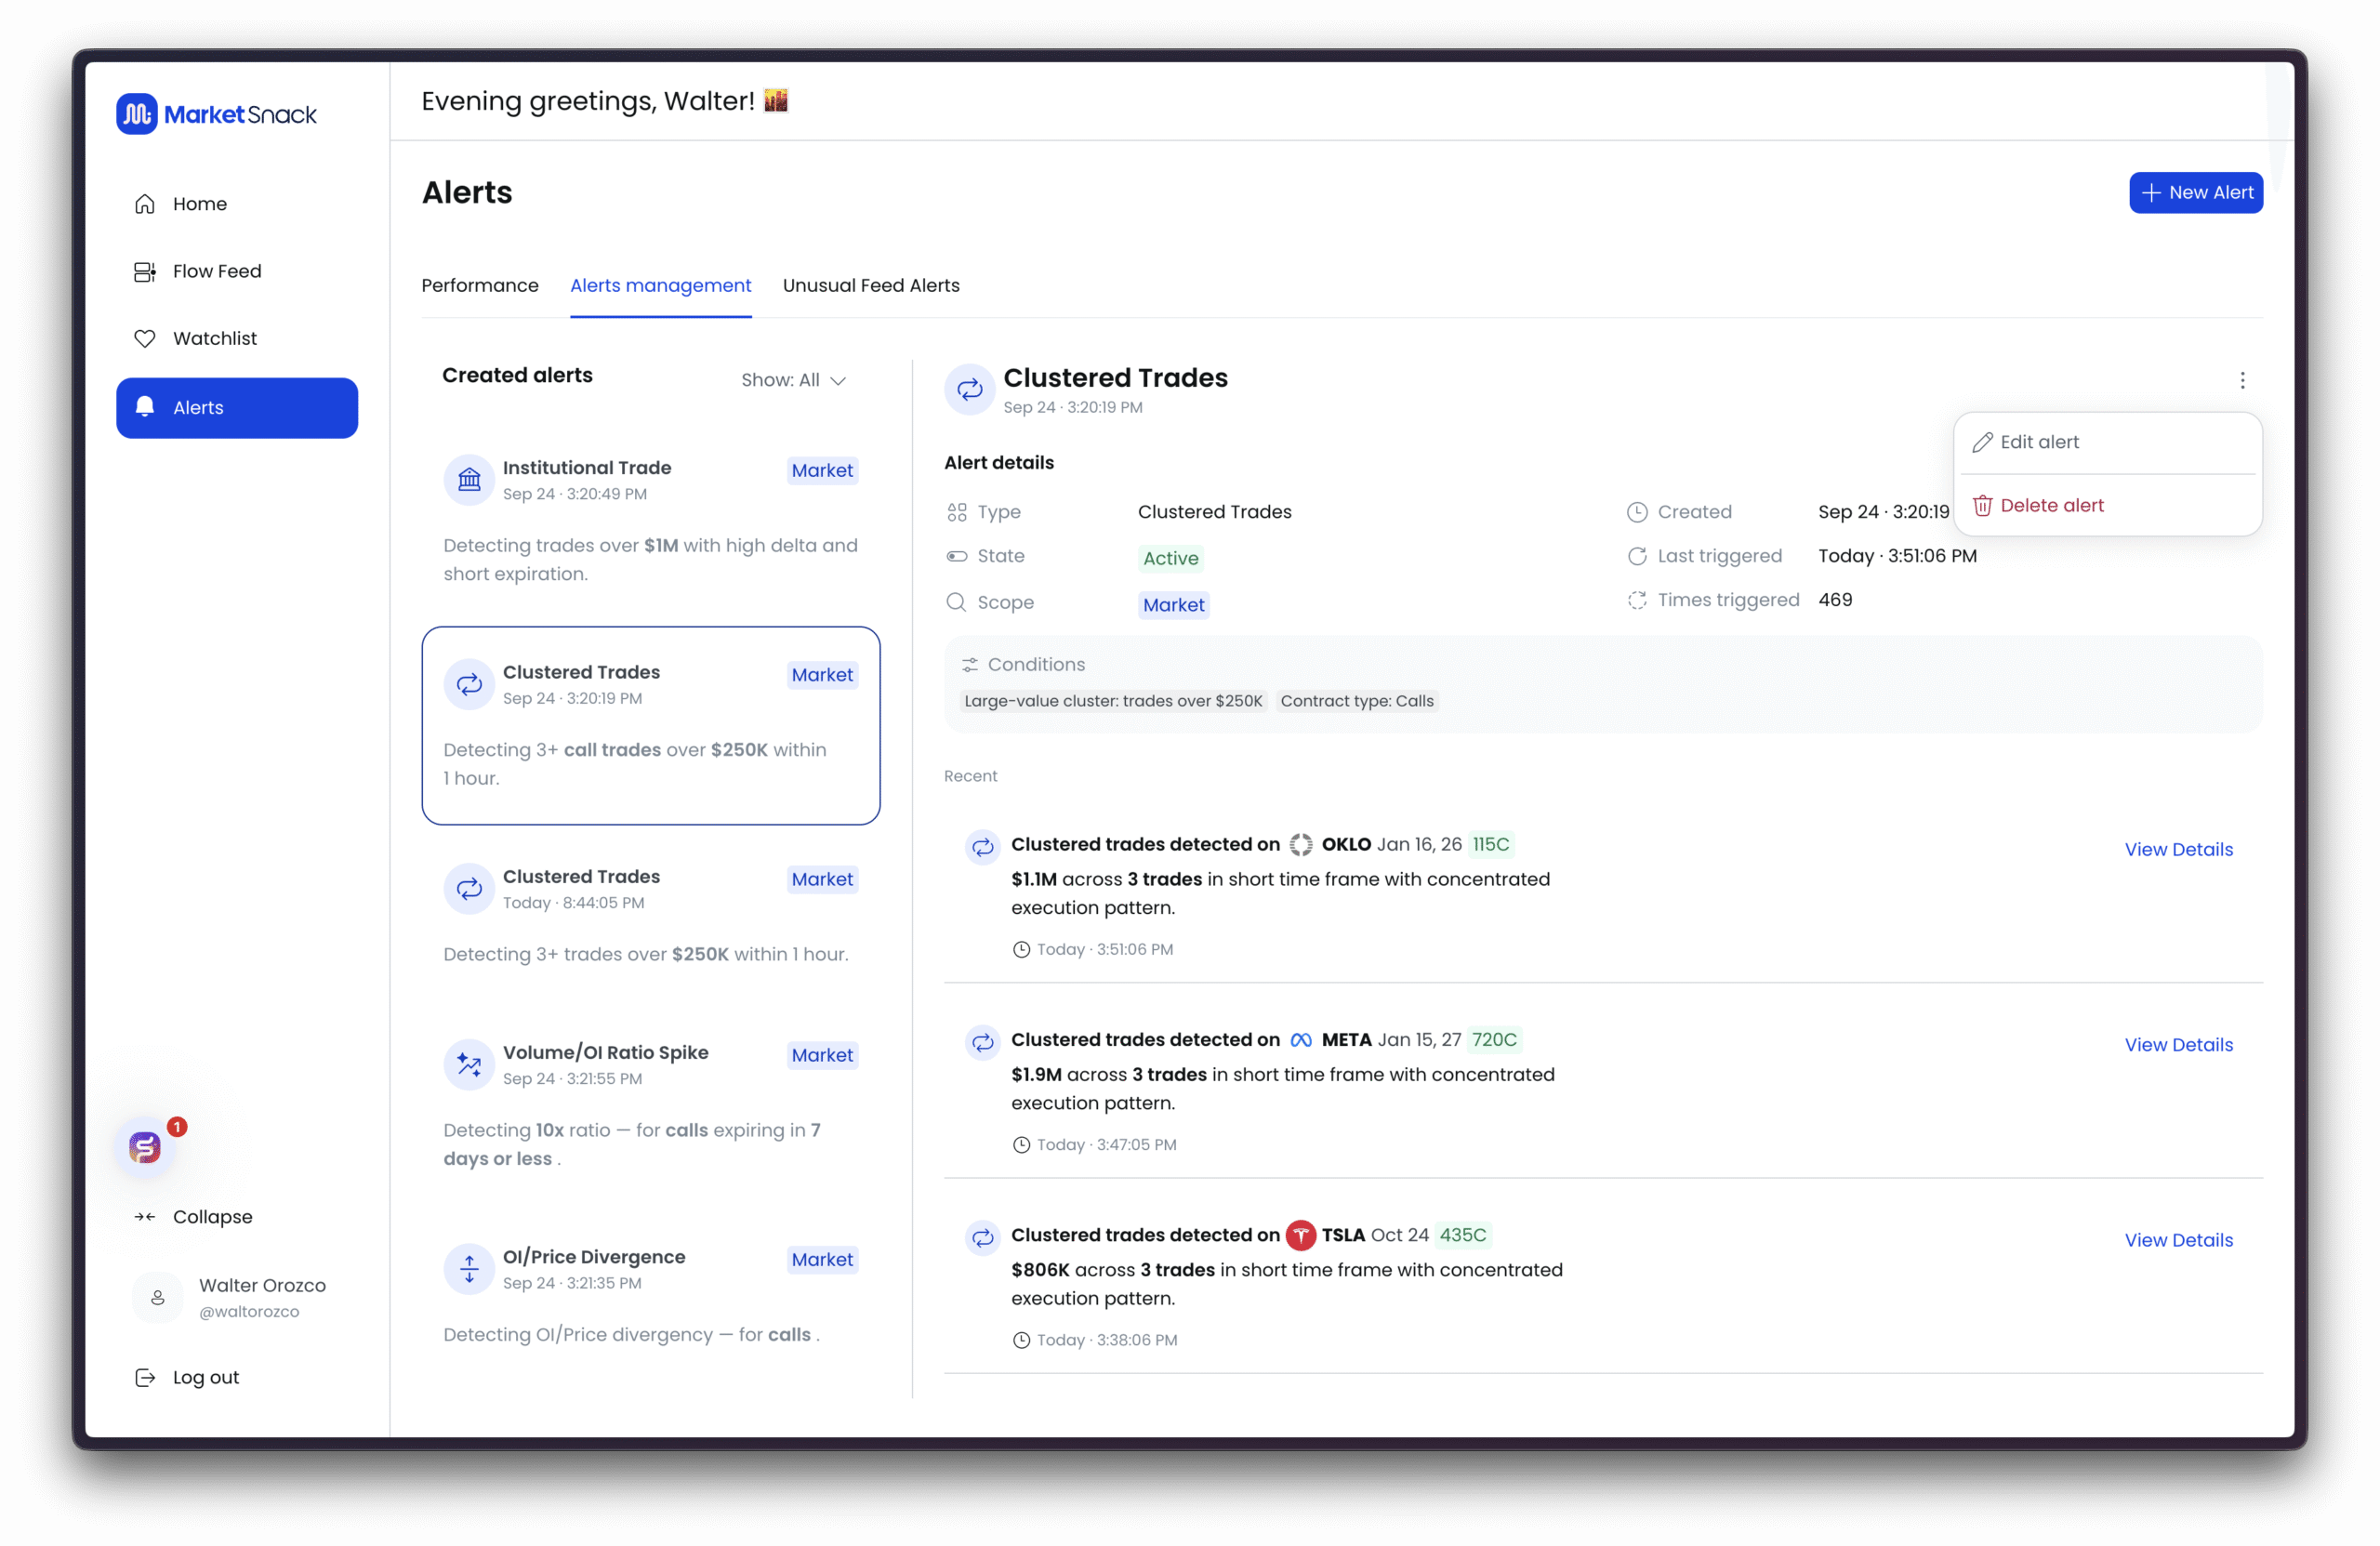
If you want to edit or delete an alert, click the three dots to the right of the alert.
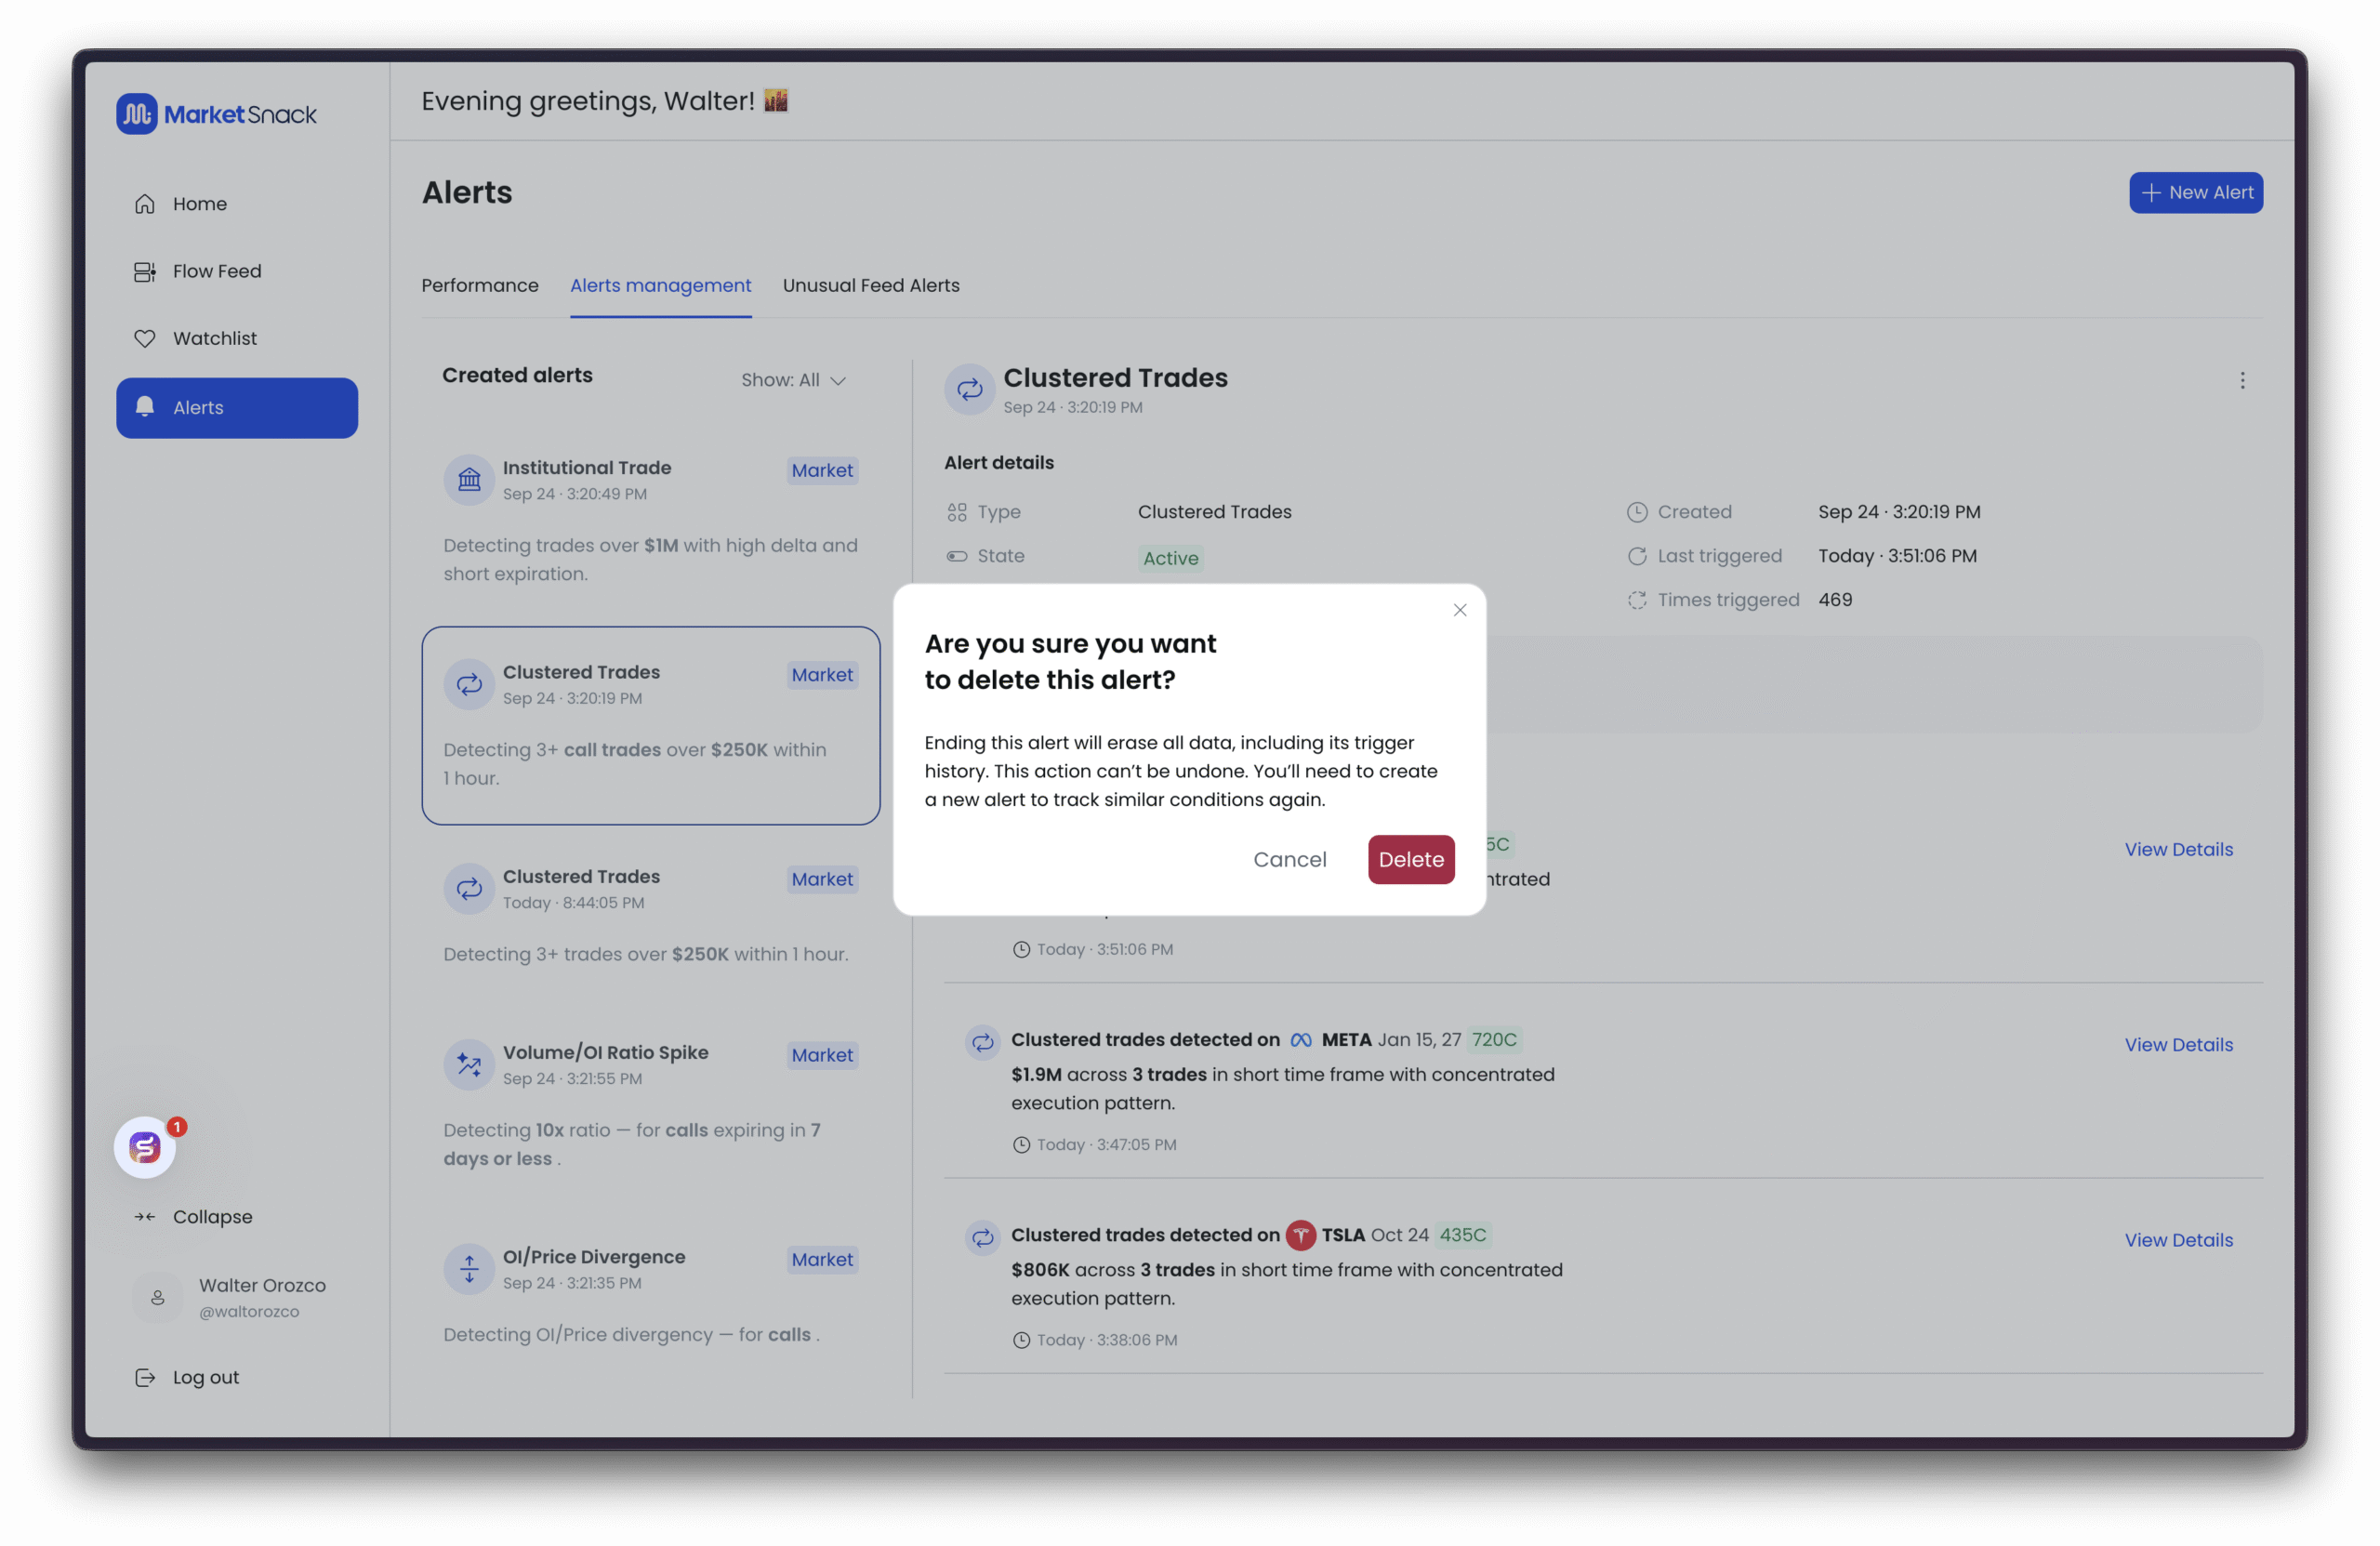
Keep in mind that if you choose to delete an alert, the action is not reversible.
Example: Institutional Trade
Options include:
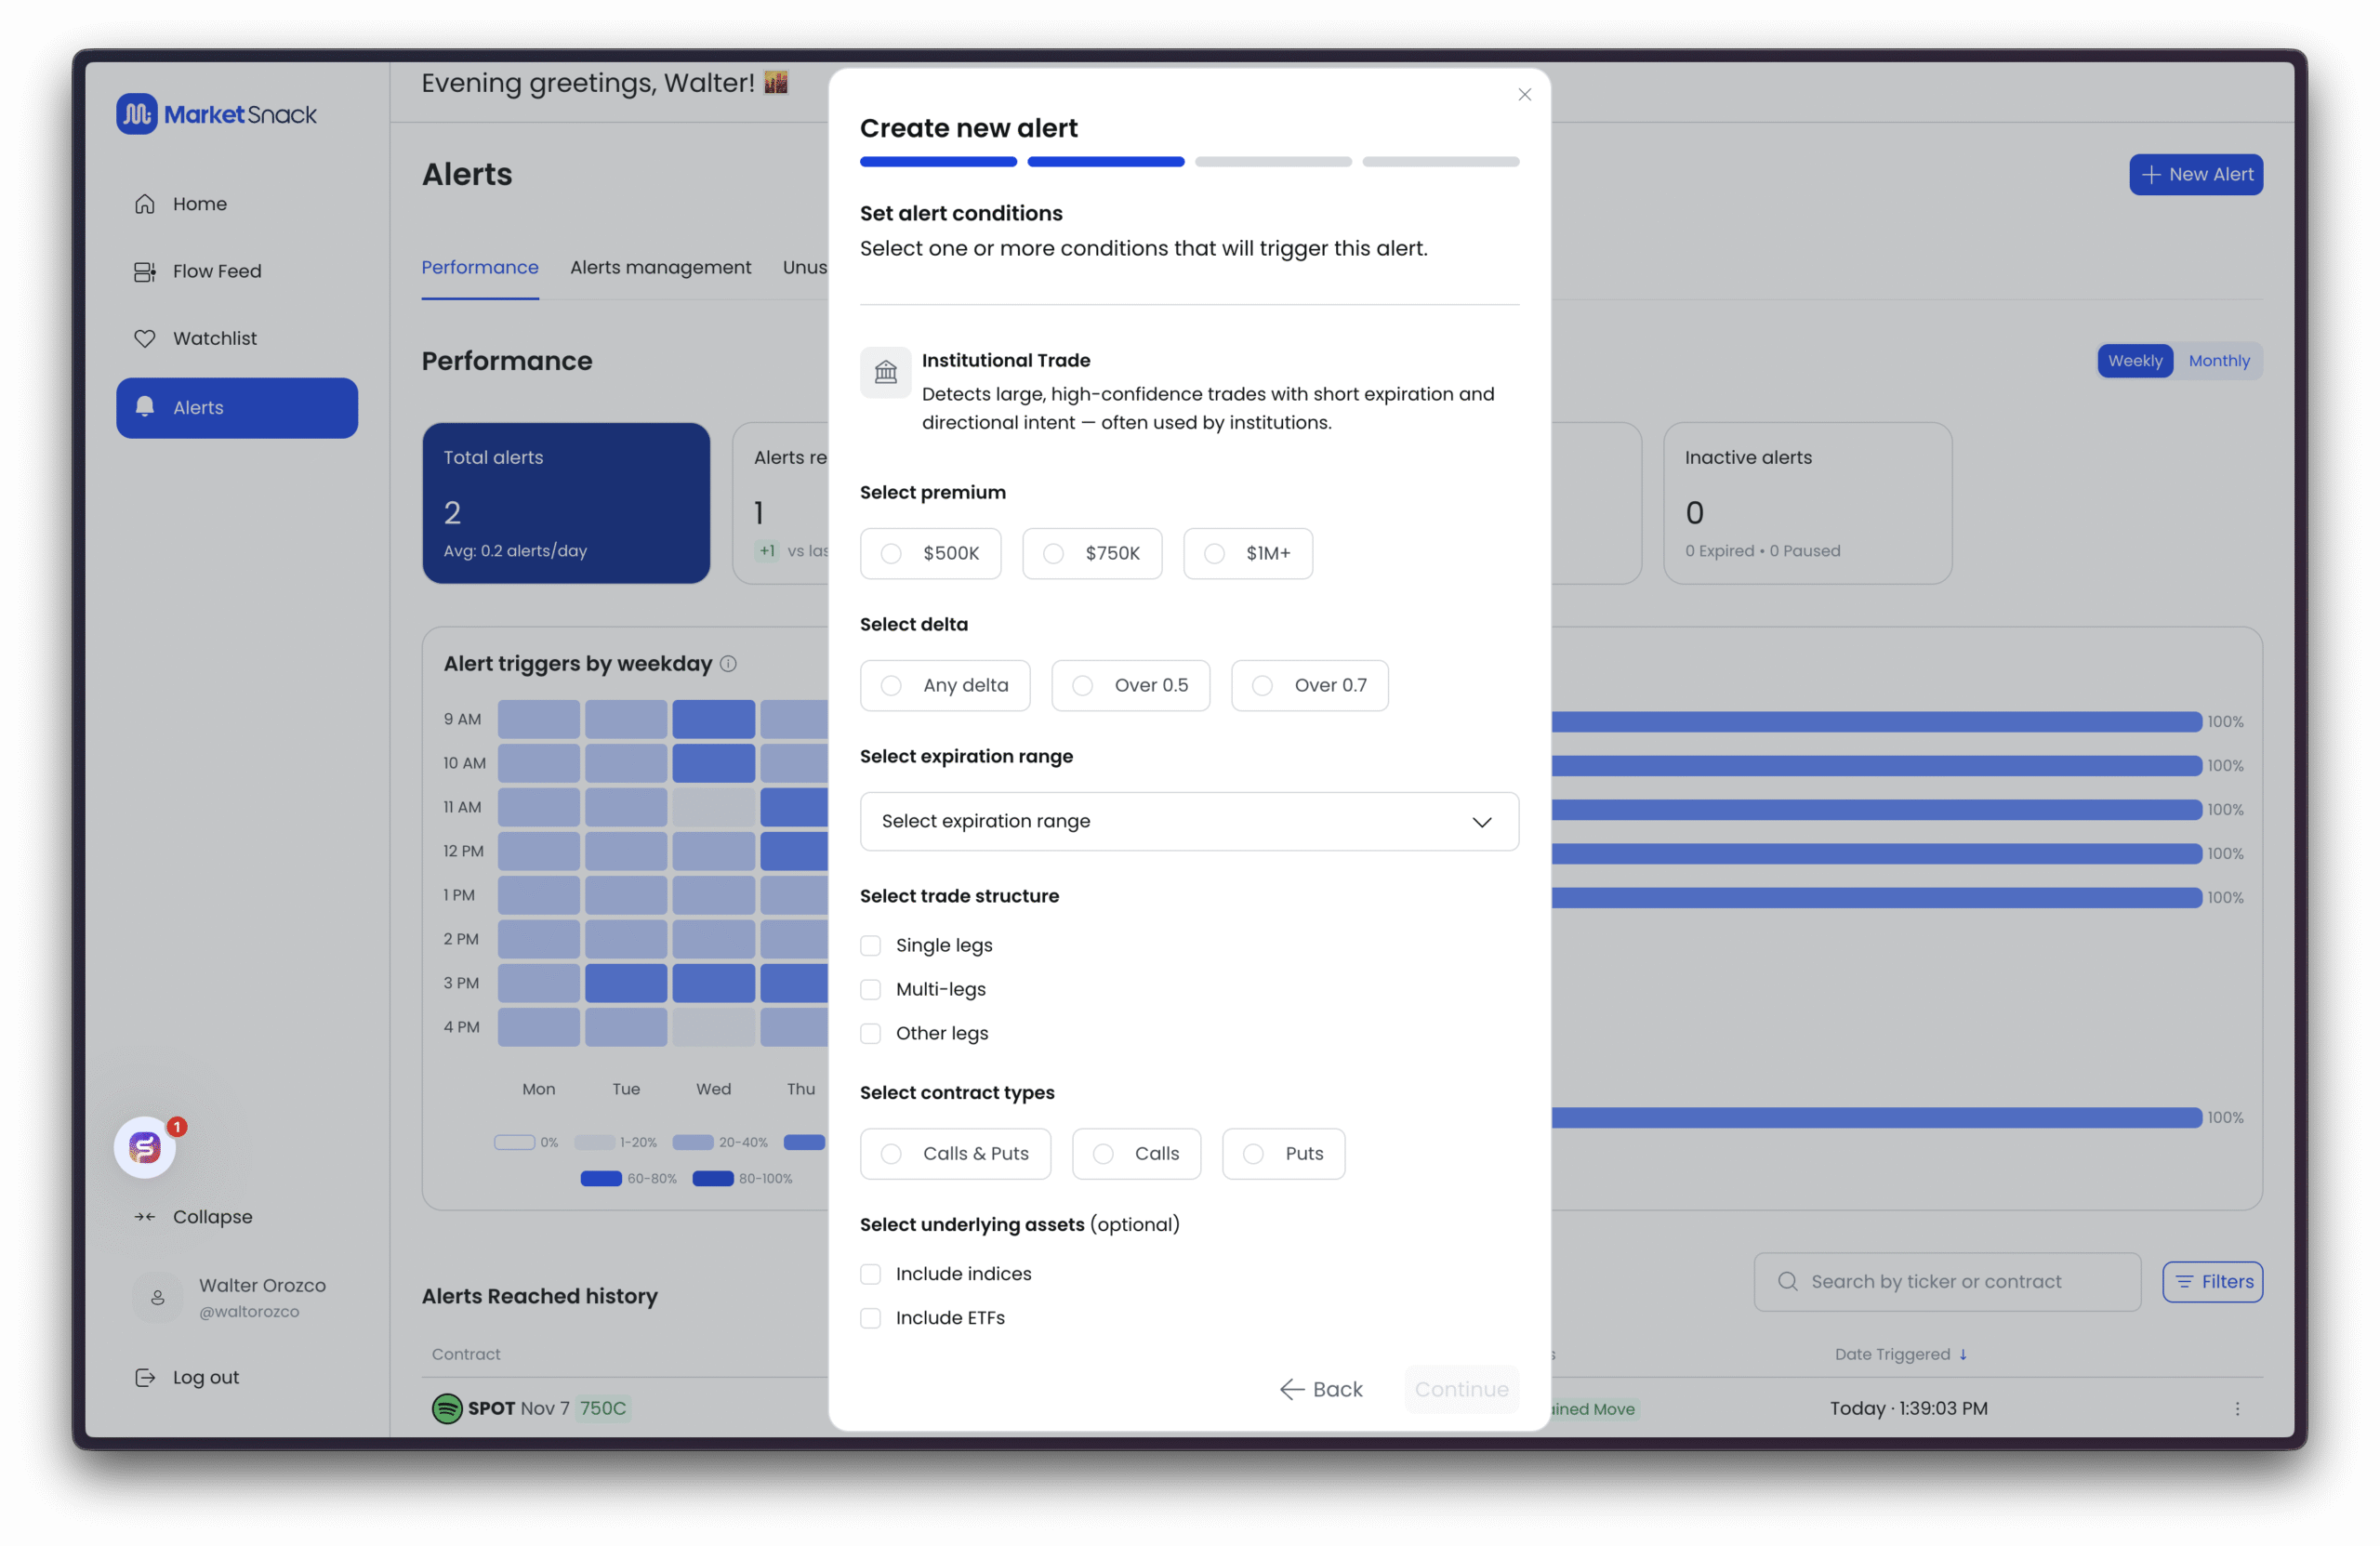
● Premium threshold – $500K / $750K / $1M+. Higher thresholds mean fewer but larger alerts.
● Delta filter – How sensitive the option should be to movements in the underlying:
○ Any – No sensitivity filter; includes all deltas.
○ Over 0.5 – Higher delta (option moves strongly with the stock); often shows directional conviction.
○ Over 0.7 – Very high delta, typically ATM/ITM contracts; fewer signals but more decisive, highly directional trades.
● Expiration range – ○ Short terms (e.g., ≤7 days) often capture tactical trades or catalyst-driven activity.
○ Longer terms reflect more strategic positioning.
● Trade structure – Choose the format of the option trade:
● Single legs – A single call or put. Clear and direct directional bet.
● Multi-legs – Spreads or combos (e.g., verticals). Often used for hedging or controlled-risk strategies.
● Other legs – Less common structures (ratios, diagonals, etc.). Useful if you want to capture the full range of non-standard strategies.
● Contract types – Calls & Puts, Calls only, Puts only.
● Underlying assets (optional) – Indices (SPX/NDX).
Tip: For highly filtered signals, start with $1M+, delta >0.7, expiration ≤7 days, and Single-leg trades. Expand criteria later for broader coverage.
Example: IV + Volume Spike
Configure:
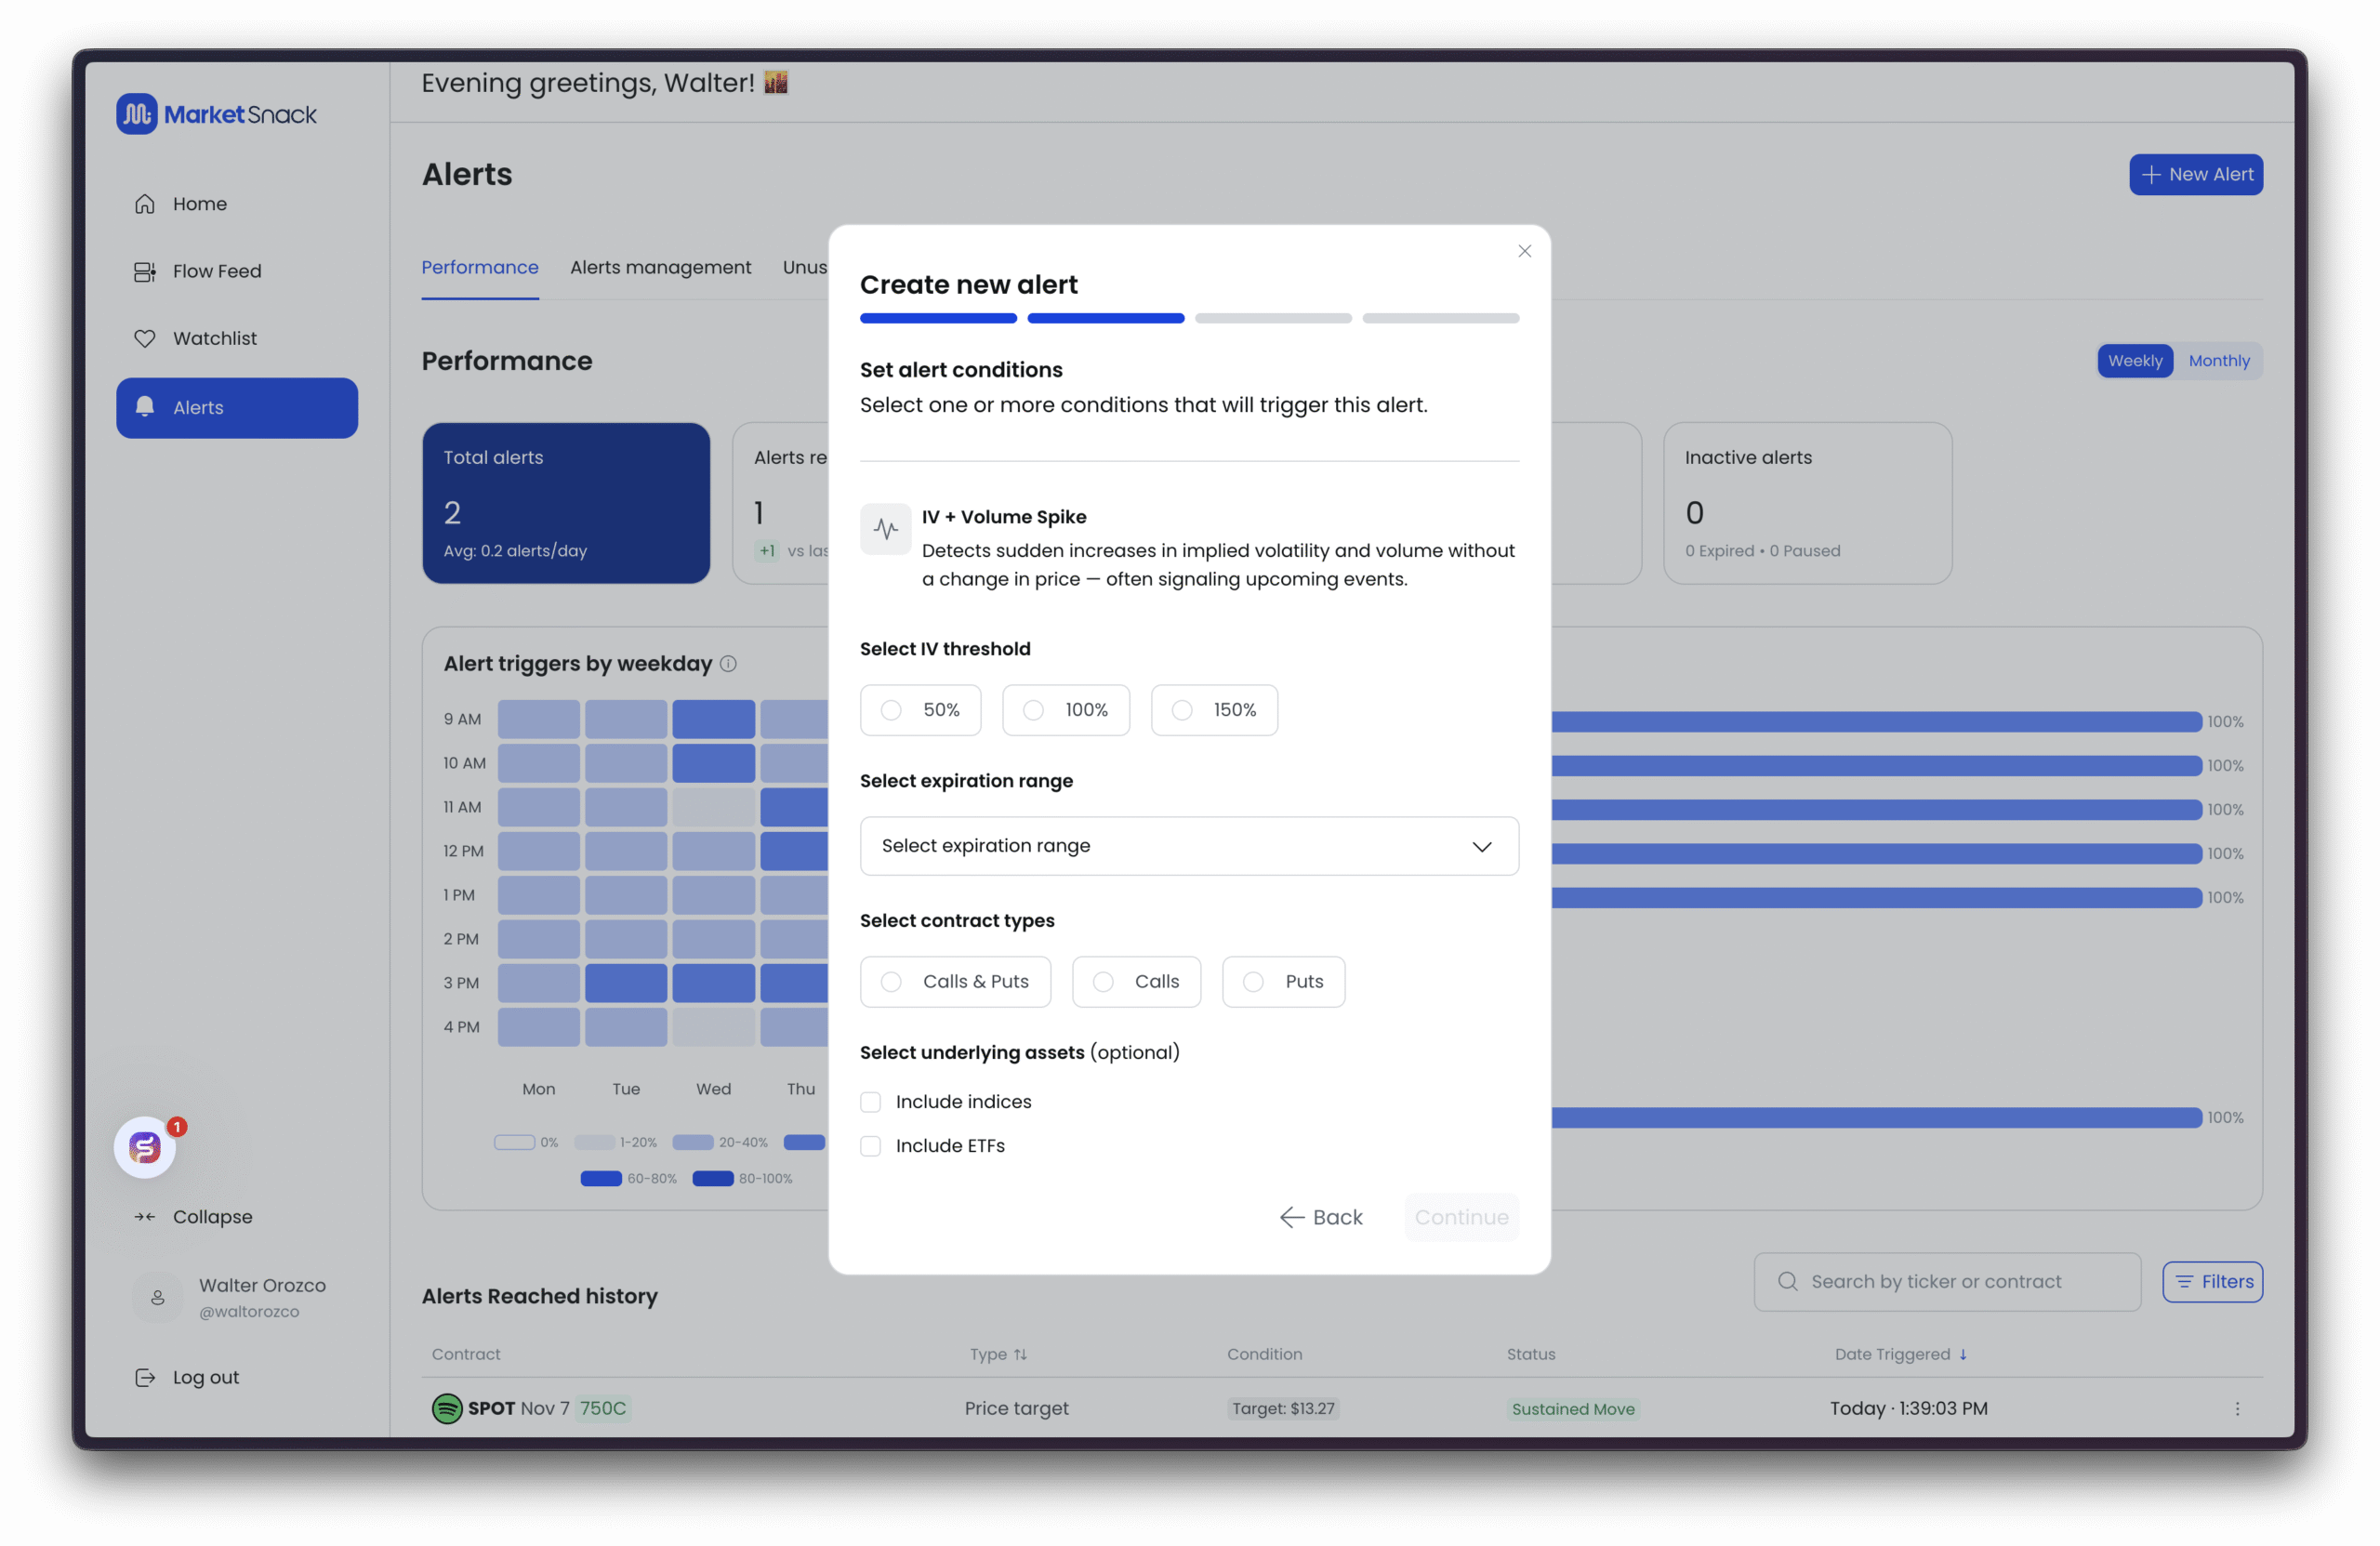
● IV threshold – 50%, 100%, or 150%. ○ Implied Volatility (IV) = the market’s expectation of future volatility in the underlying asset, derived from option prices.
○ 50% → Sensitive, more signals but noisier.
○ 100% → Balanced between coverage and quality.
○ 150% → Only extreme spikes, fewer but stronger signals.
In simple terms: the IV threshold sets how “big” a volatility spike must be before it triggers an alert.
● Expiration range – Short-term vs longer-term contracts.
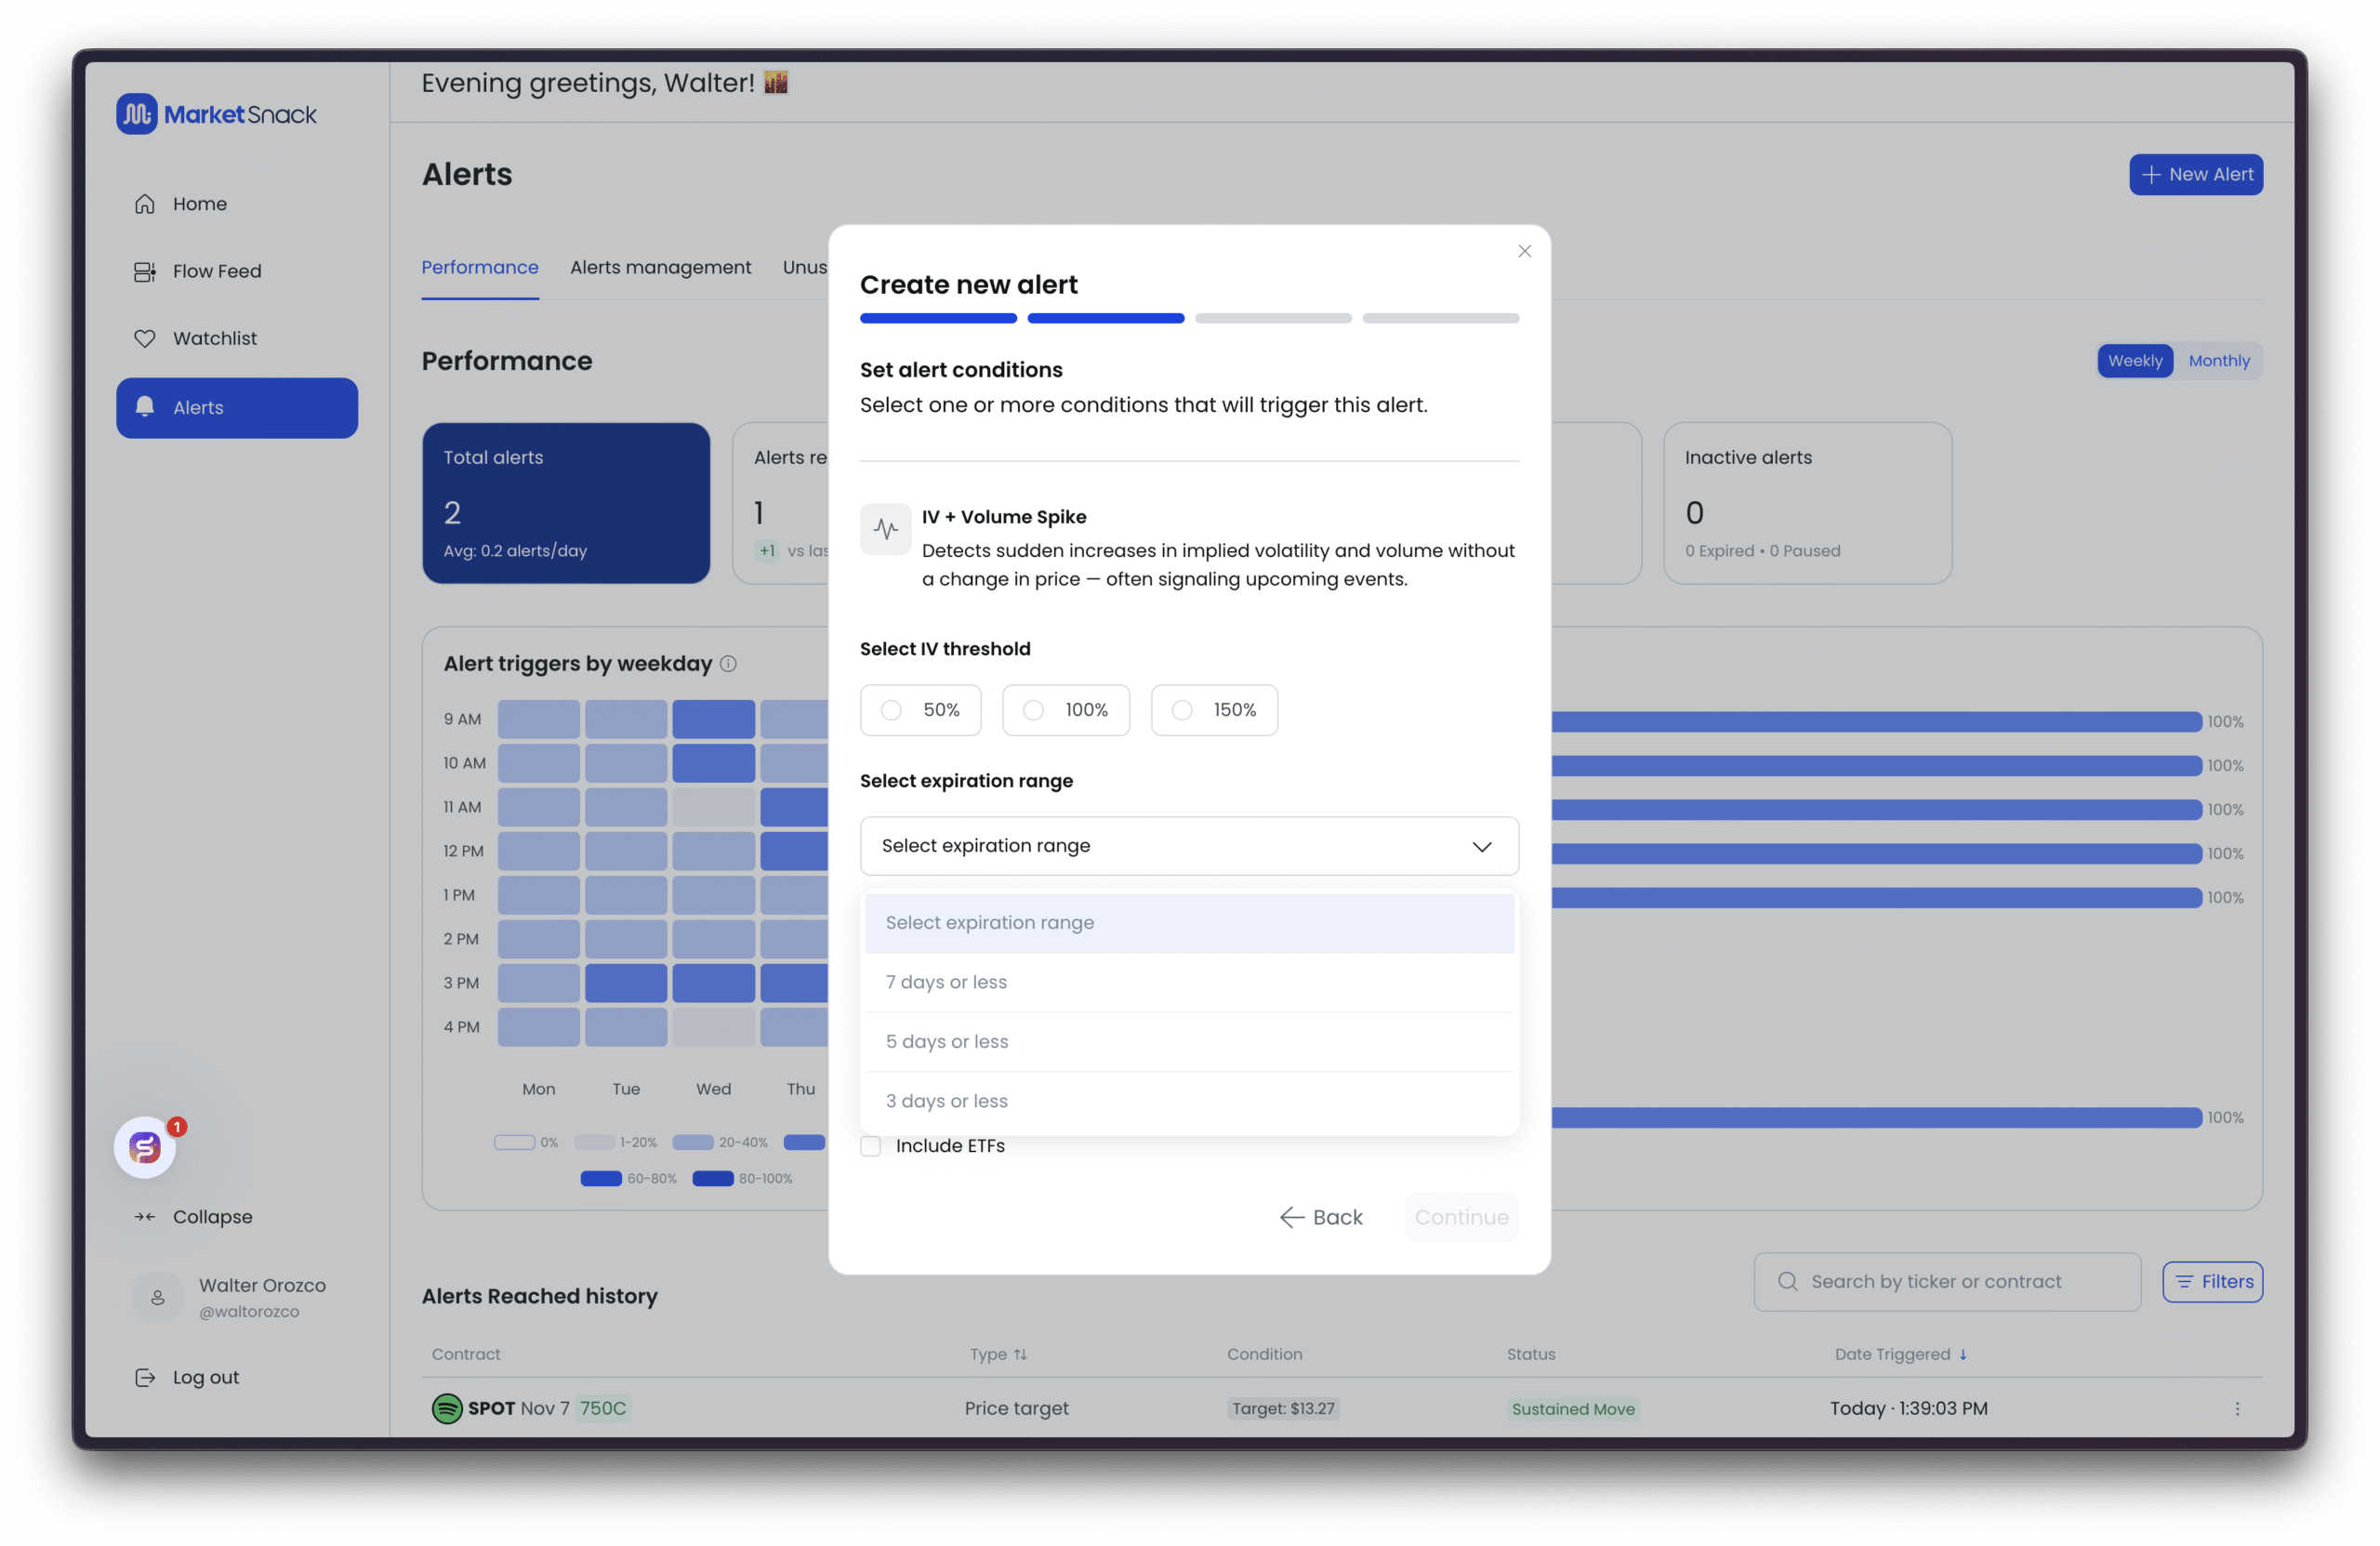
● Contract types – Calls & Puts, Calls, or Puts.
● Underlying assets (optional) – Indices or ETFs.
Tip: Start with 100% IV and short expirations for balance between quality and coverage.
Example: OI/Price Divergence

Configure:
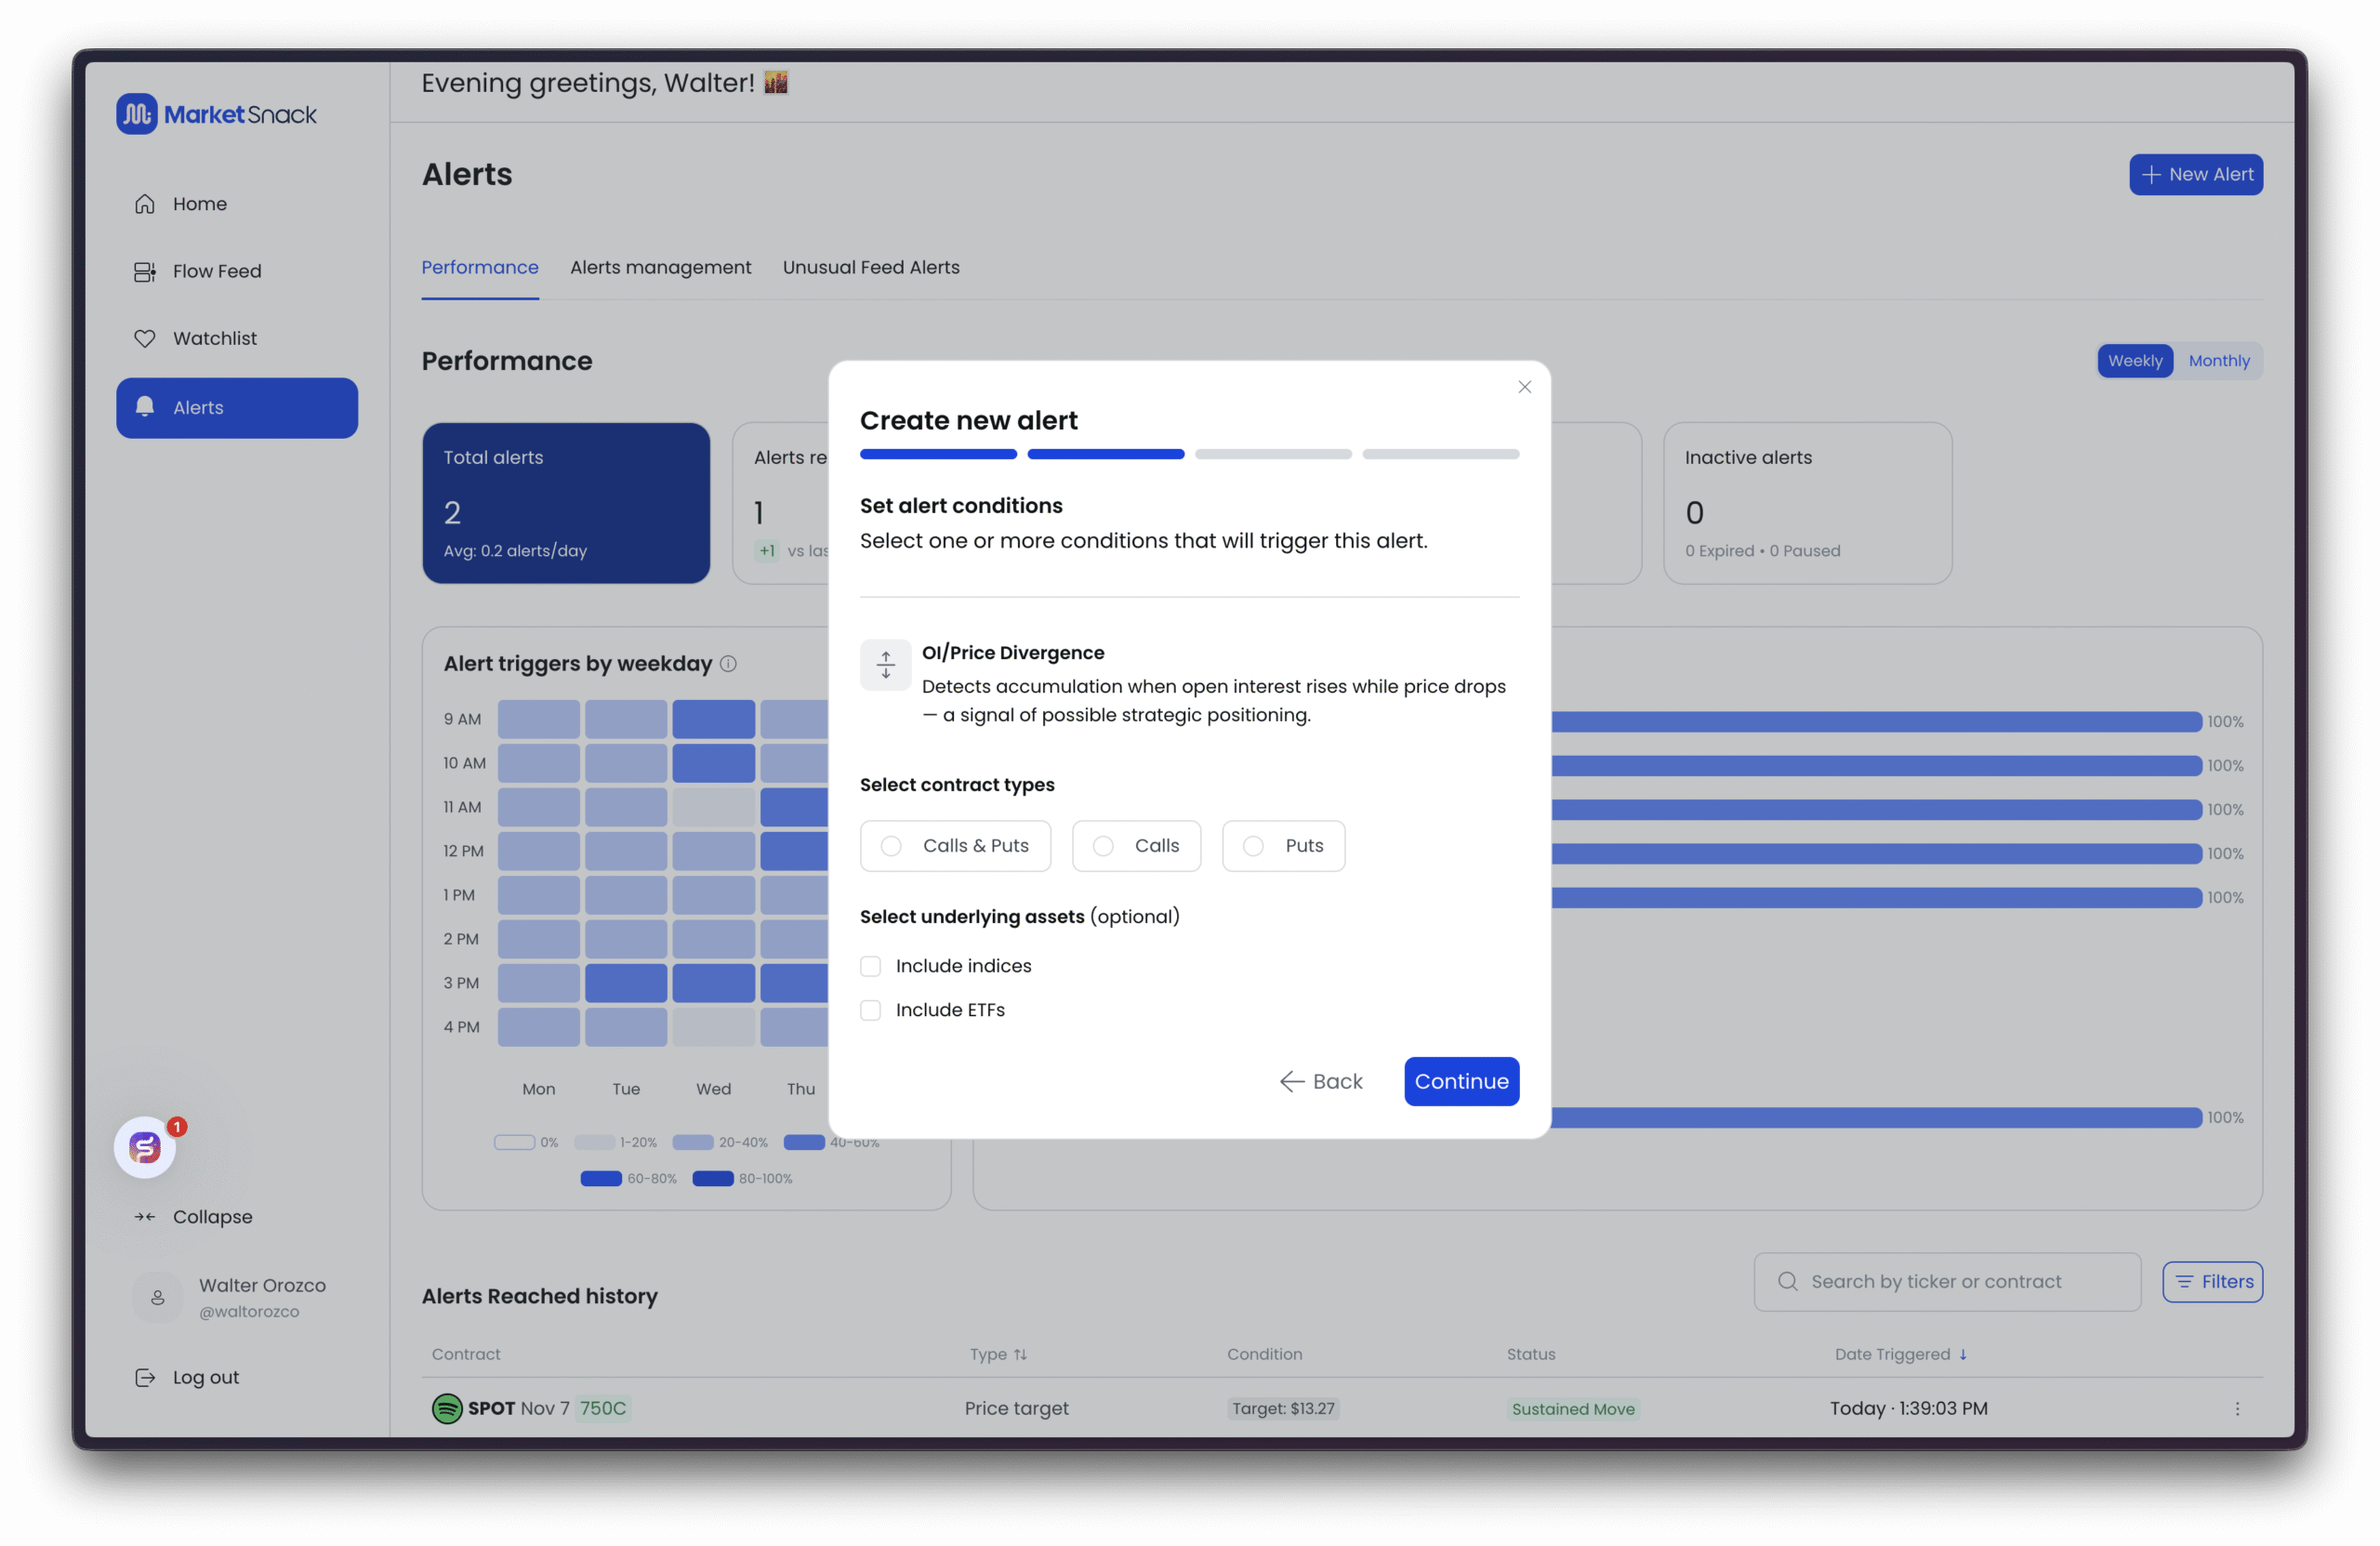
● Contract types – Calls & Puts, Calls, or Puts.
● Underlying assets (optional) – Indices and/or ETFs.
Tip: Combine this alert with your support/resistance levels.
● OI↑ / Price↓ near support → may indicate contrarian accumulation.
● OI↑ / Price↑ → supports continuation.
Example: Volume/OI Ratio Spike
Configure:
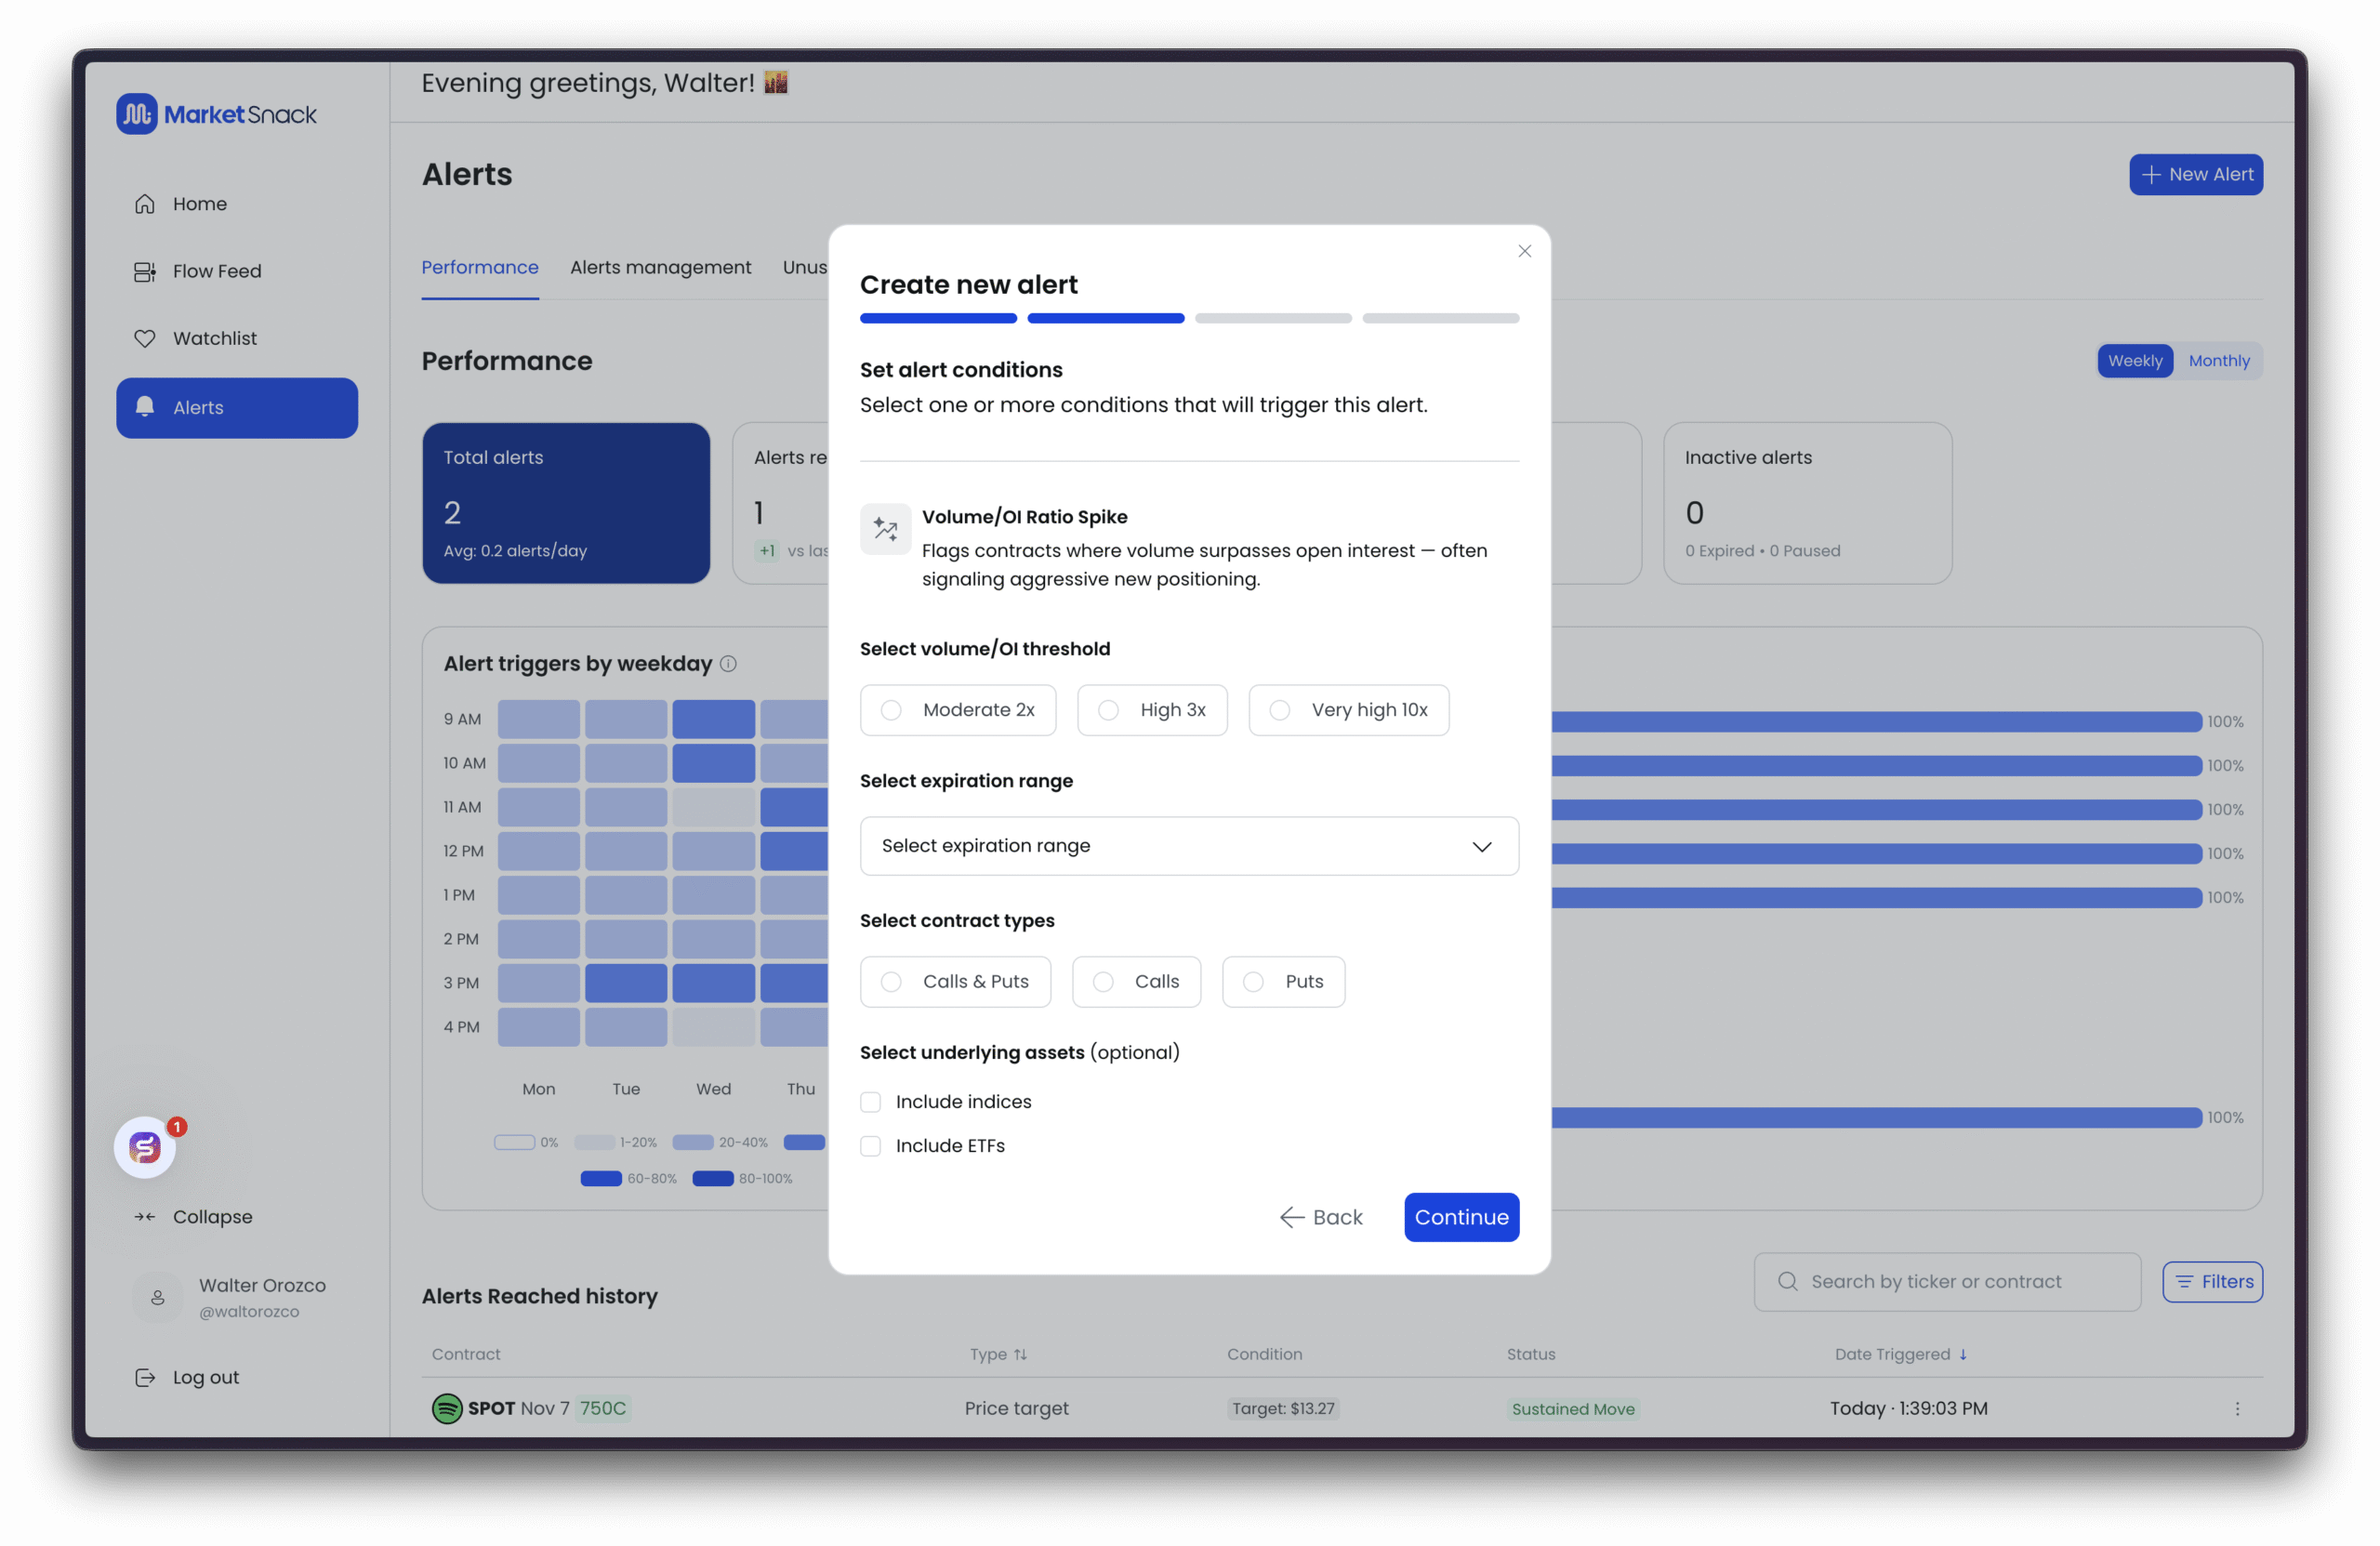
Volume/OI Ratio Spike
This alert detects contracts where the current day’s trading volume greatly exceeds the existing Open Interest (OI), signaling aggressive opening of new positions.
Select volume/OI threshold
● Moderate 2x – Volume ≥ 2× OI. Generates more signals; useful for broad coverage.
● High 3x – Volume ≥ 3× OI. Good balance between quantity and quality.
● Very High 10x – Volume ≥ 10× OI. Rare but very powerful signals, often indicating strong new interest.
● Expiration range – Short, medium, or long term.
● Contract types – Calls & Puts, Calls only, Puts only.
● Underlying assets (optional) – Indices and/or ETFs.
Tip: For quality signals, start with High 3x and a short expiration. For rare, exceptional findings, use Very High 10x.
Example: Contract Alerts
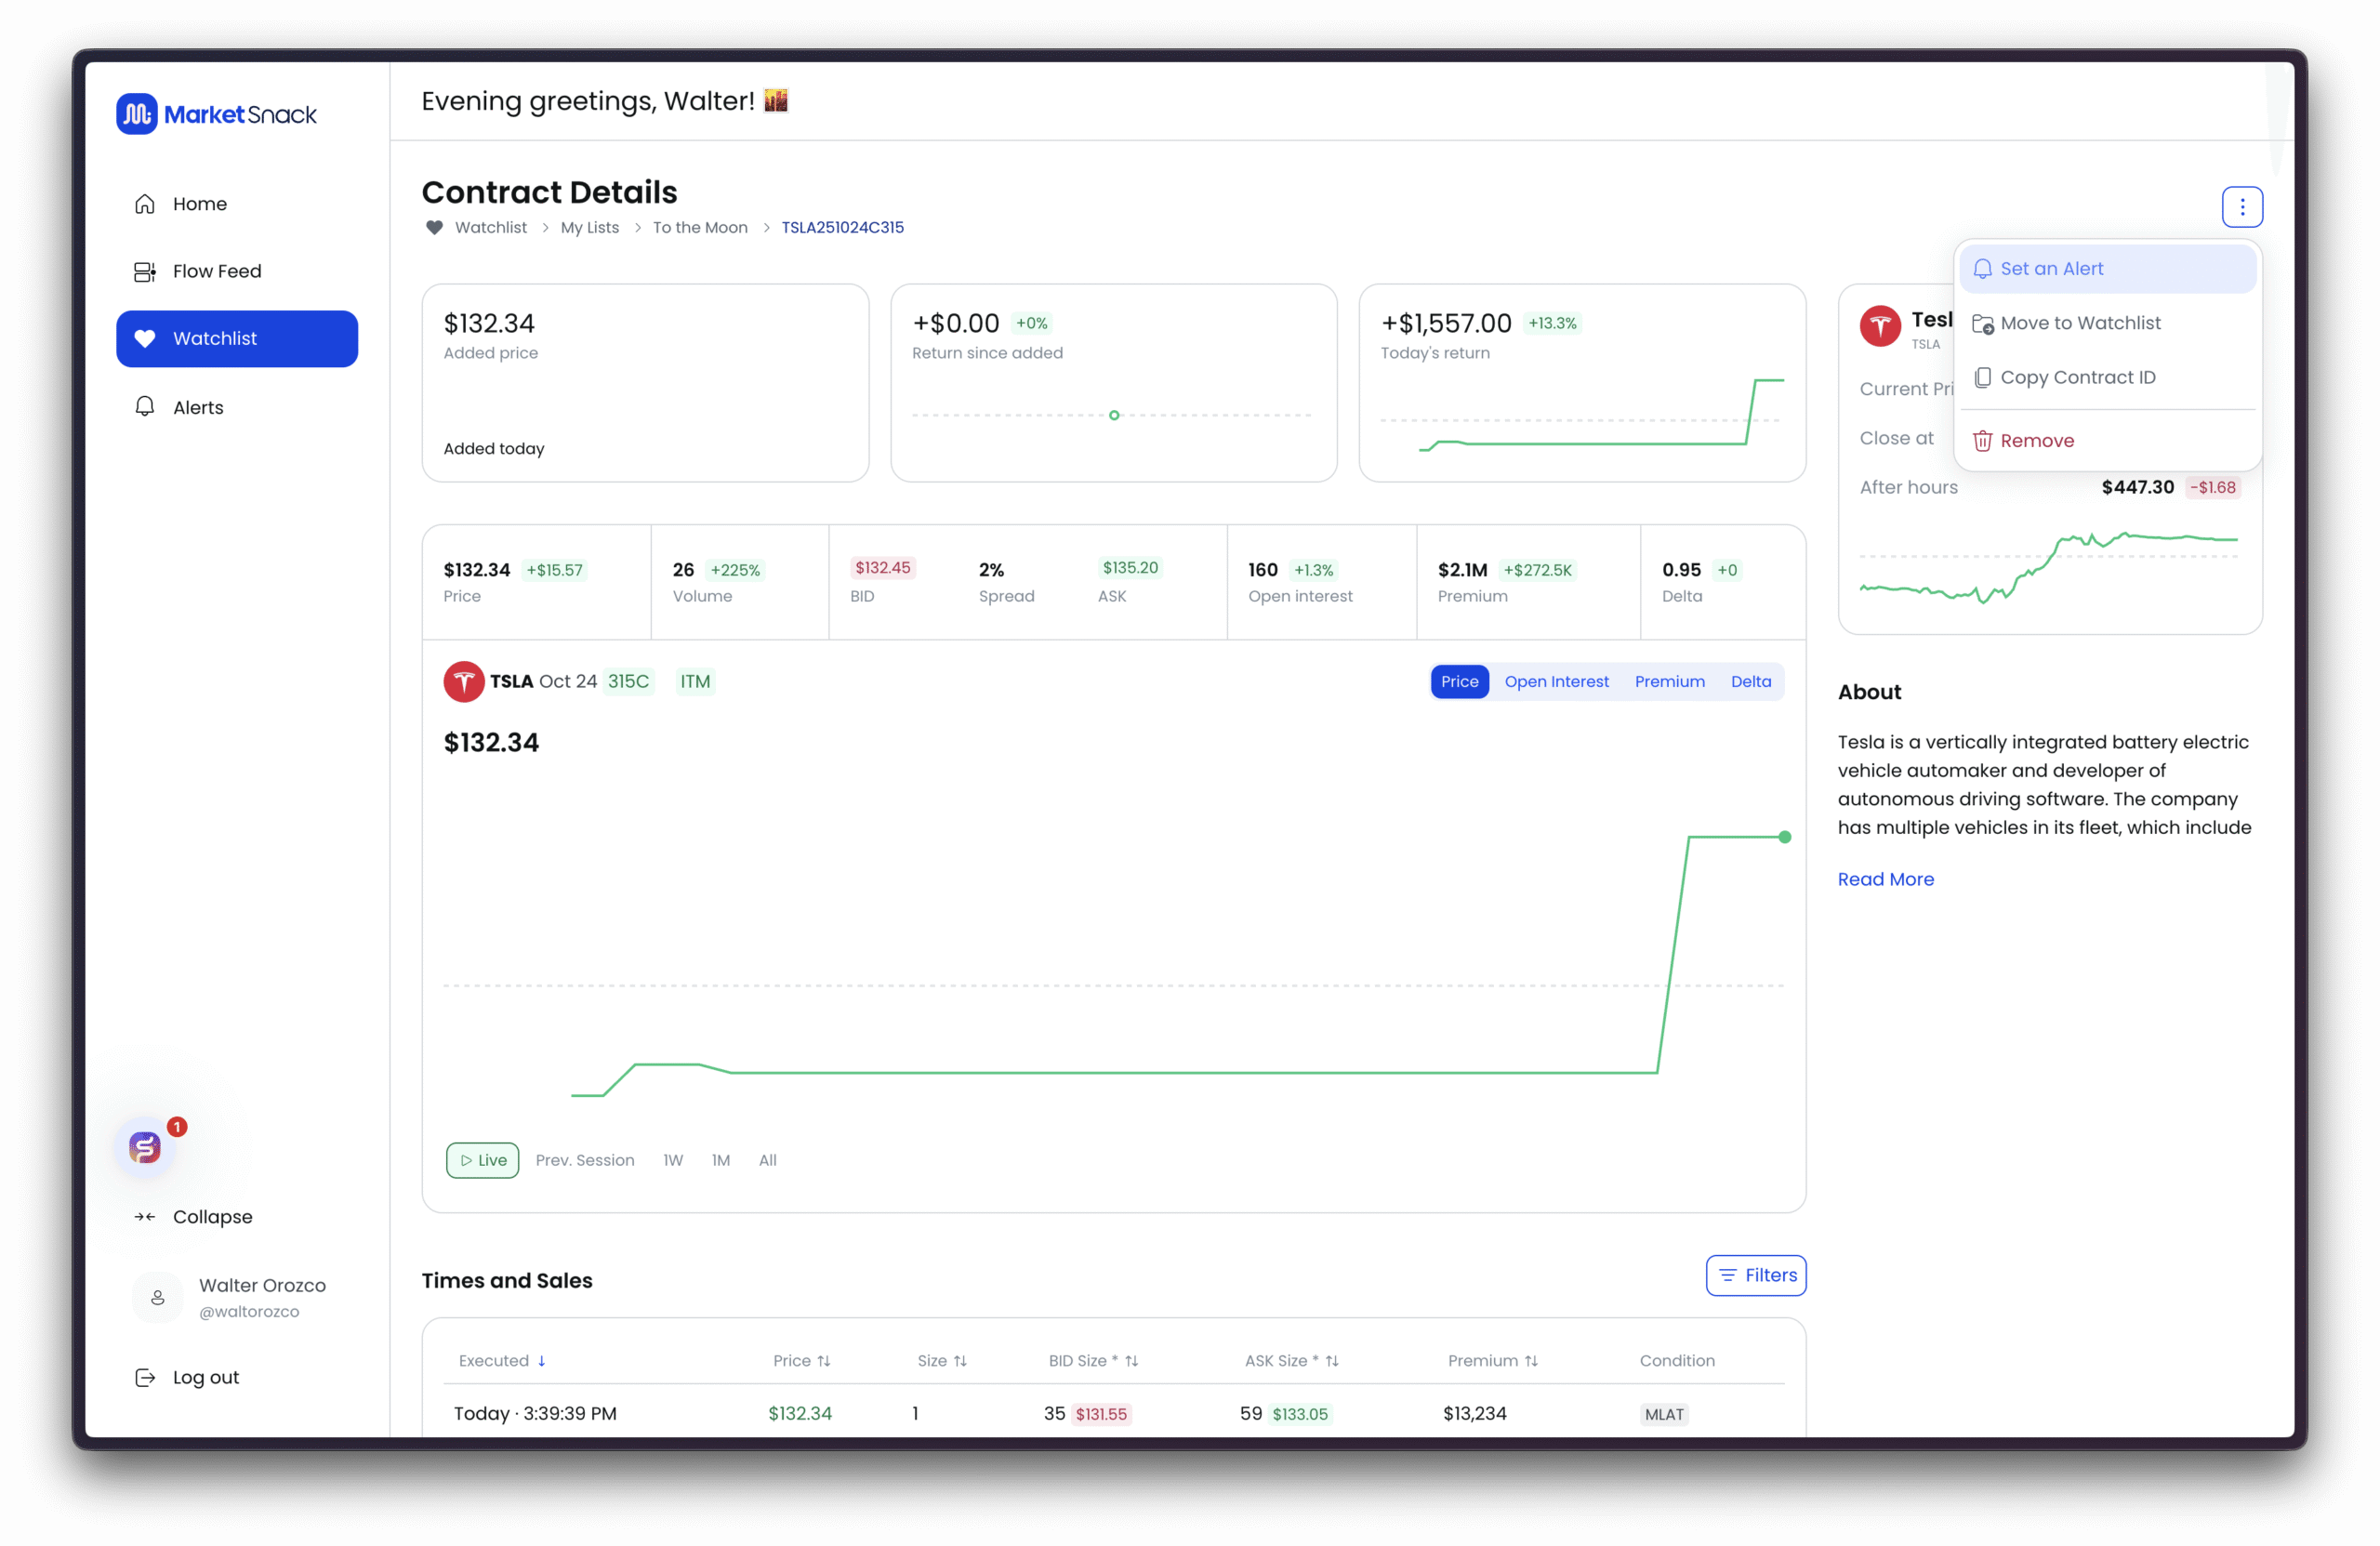
Instead of market-wide, you can attach alerts directly to contracts already in your Watchlist.
● Choose the contract.
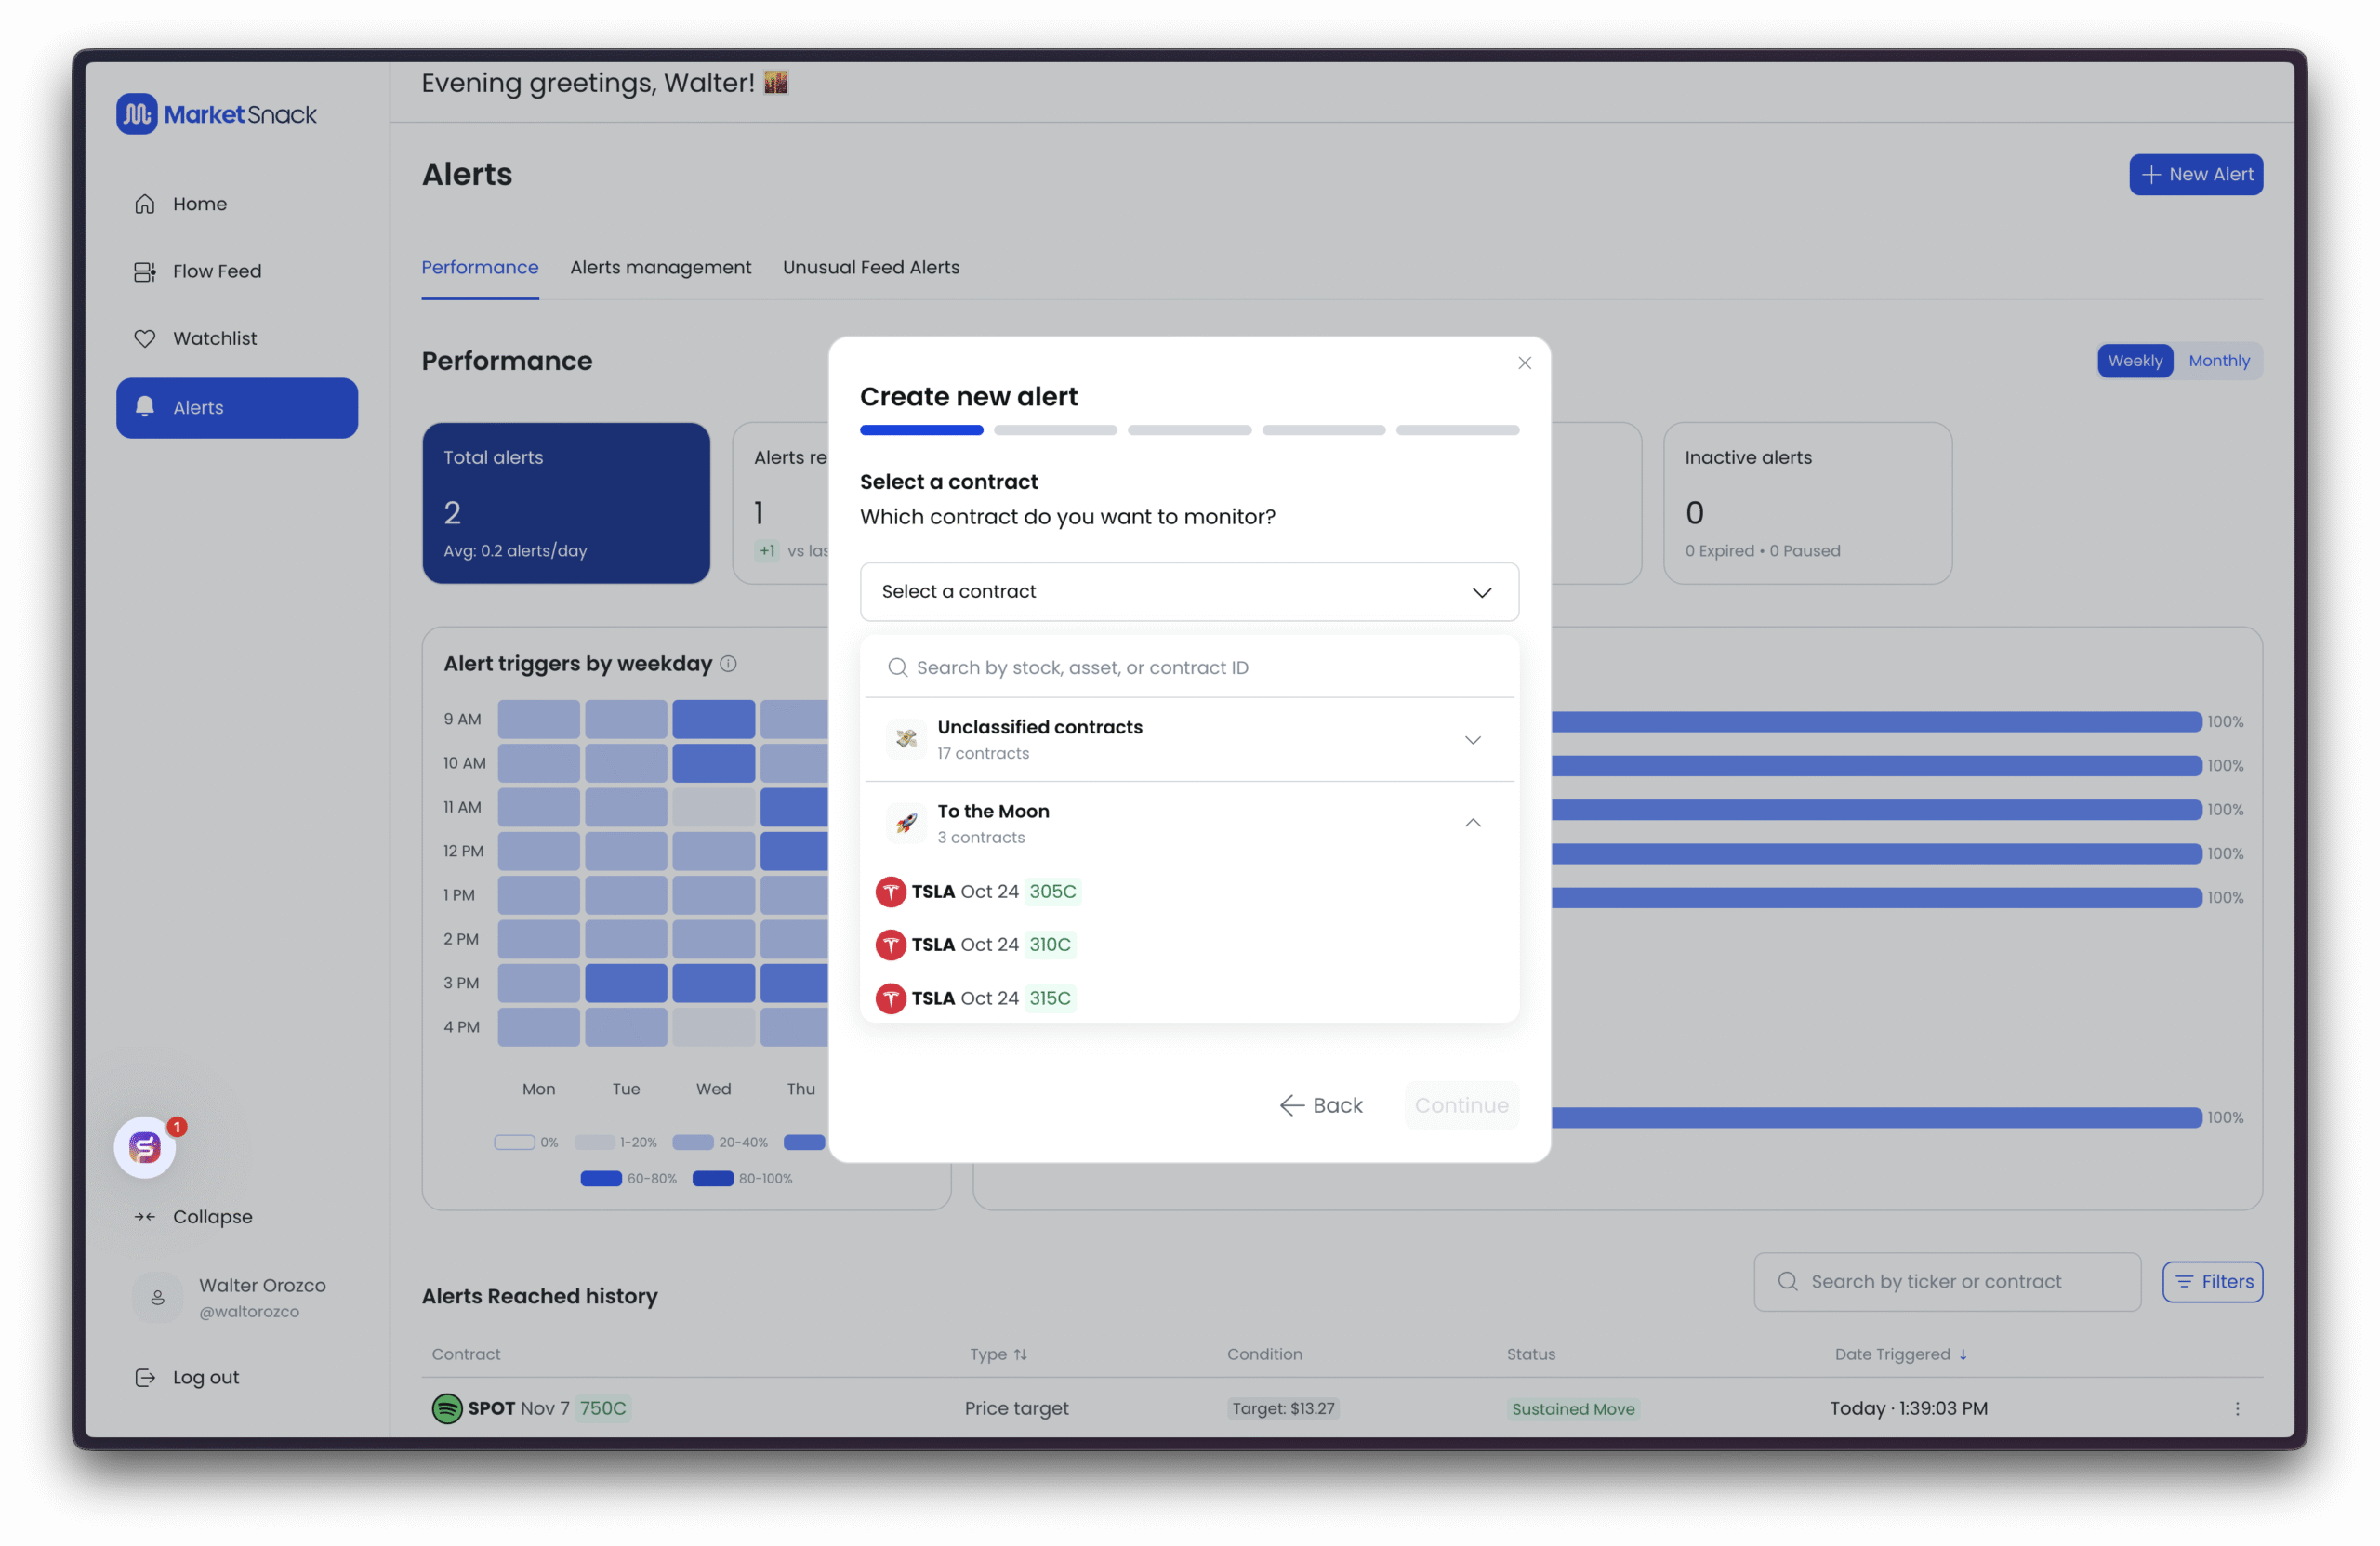
● Select alert type (e.g., price change, OI increase, volume spike, specific level).
● Confirm details and create the alert.
You can also do this directly from the Watchlist by clicking the three dots next to a contract.
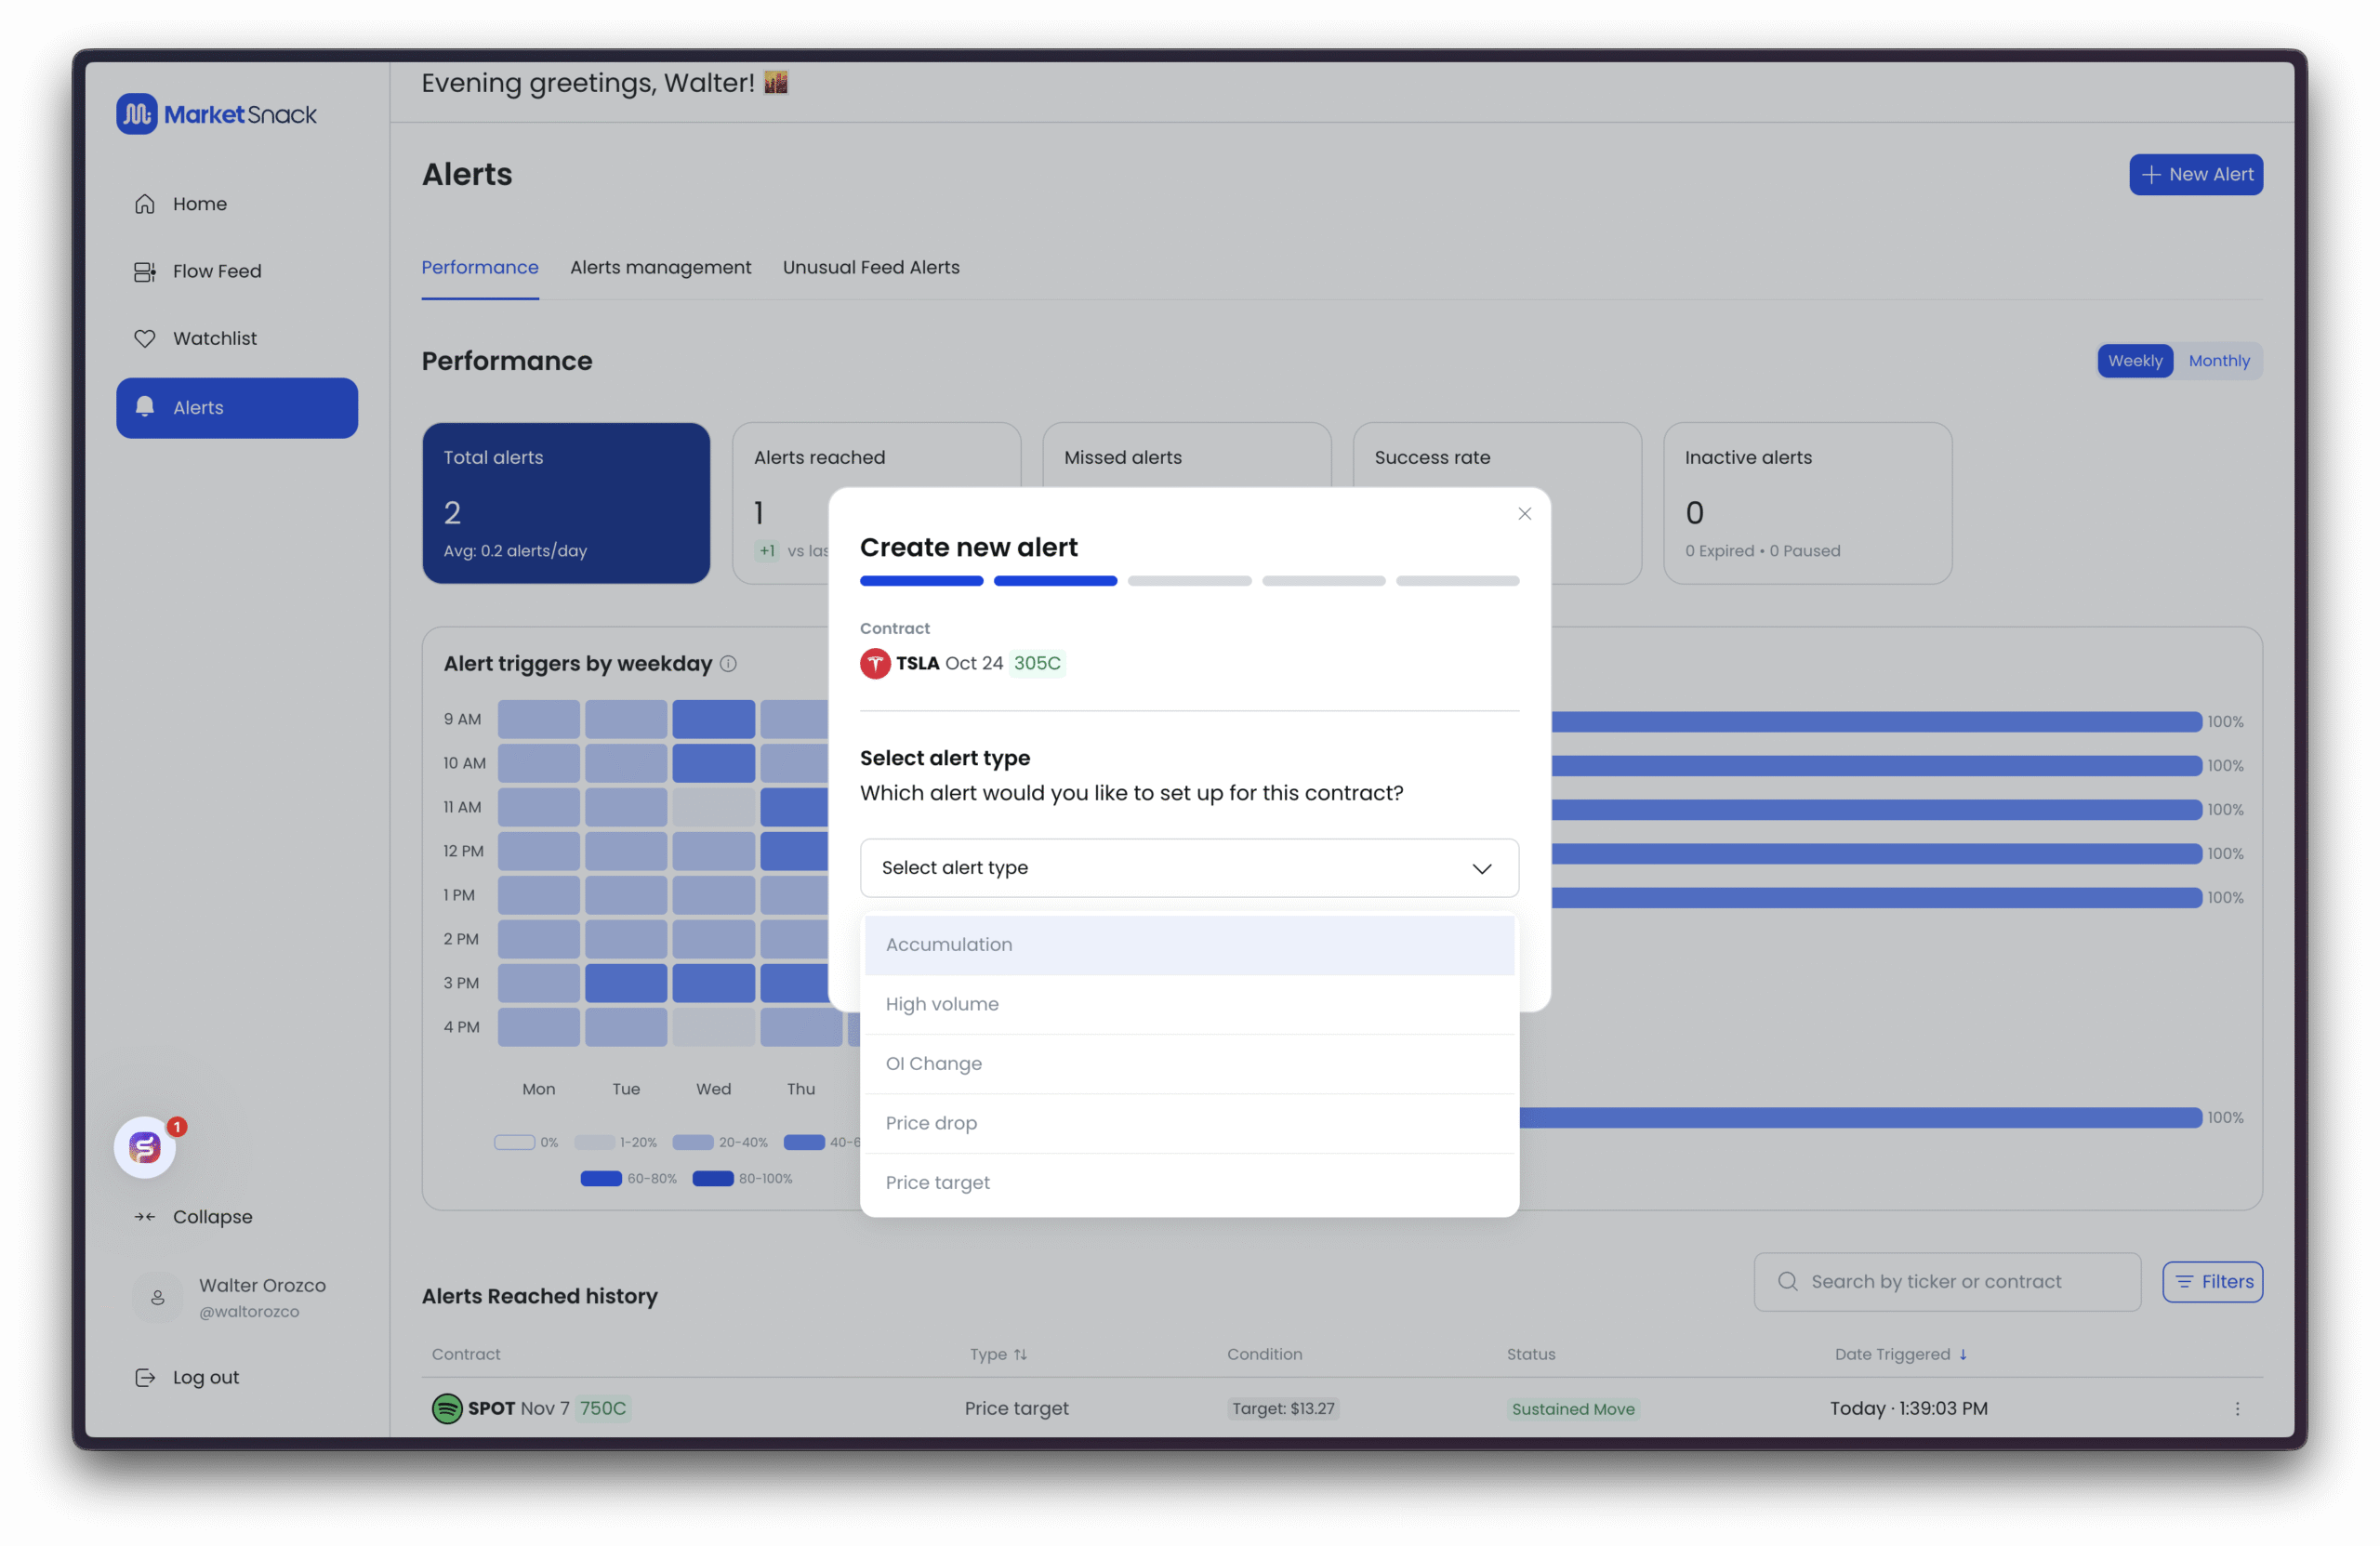
You can create alerts on an individual option contract to monitor highly targeted activity. These alerts can be set based on the following conditions:
● Accumulation – Detects when multiple trades begin to build positions in the same contract, suggesting coordinated interest.
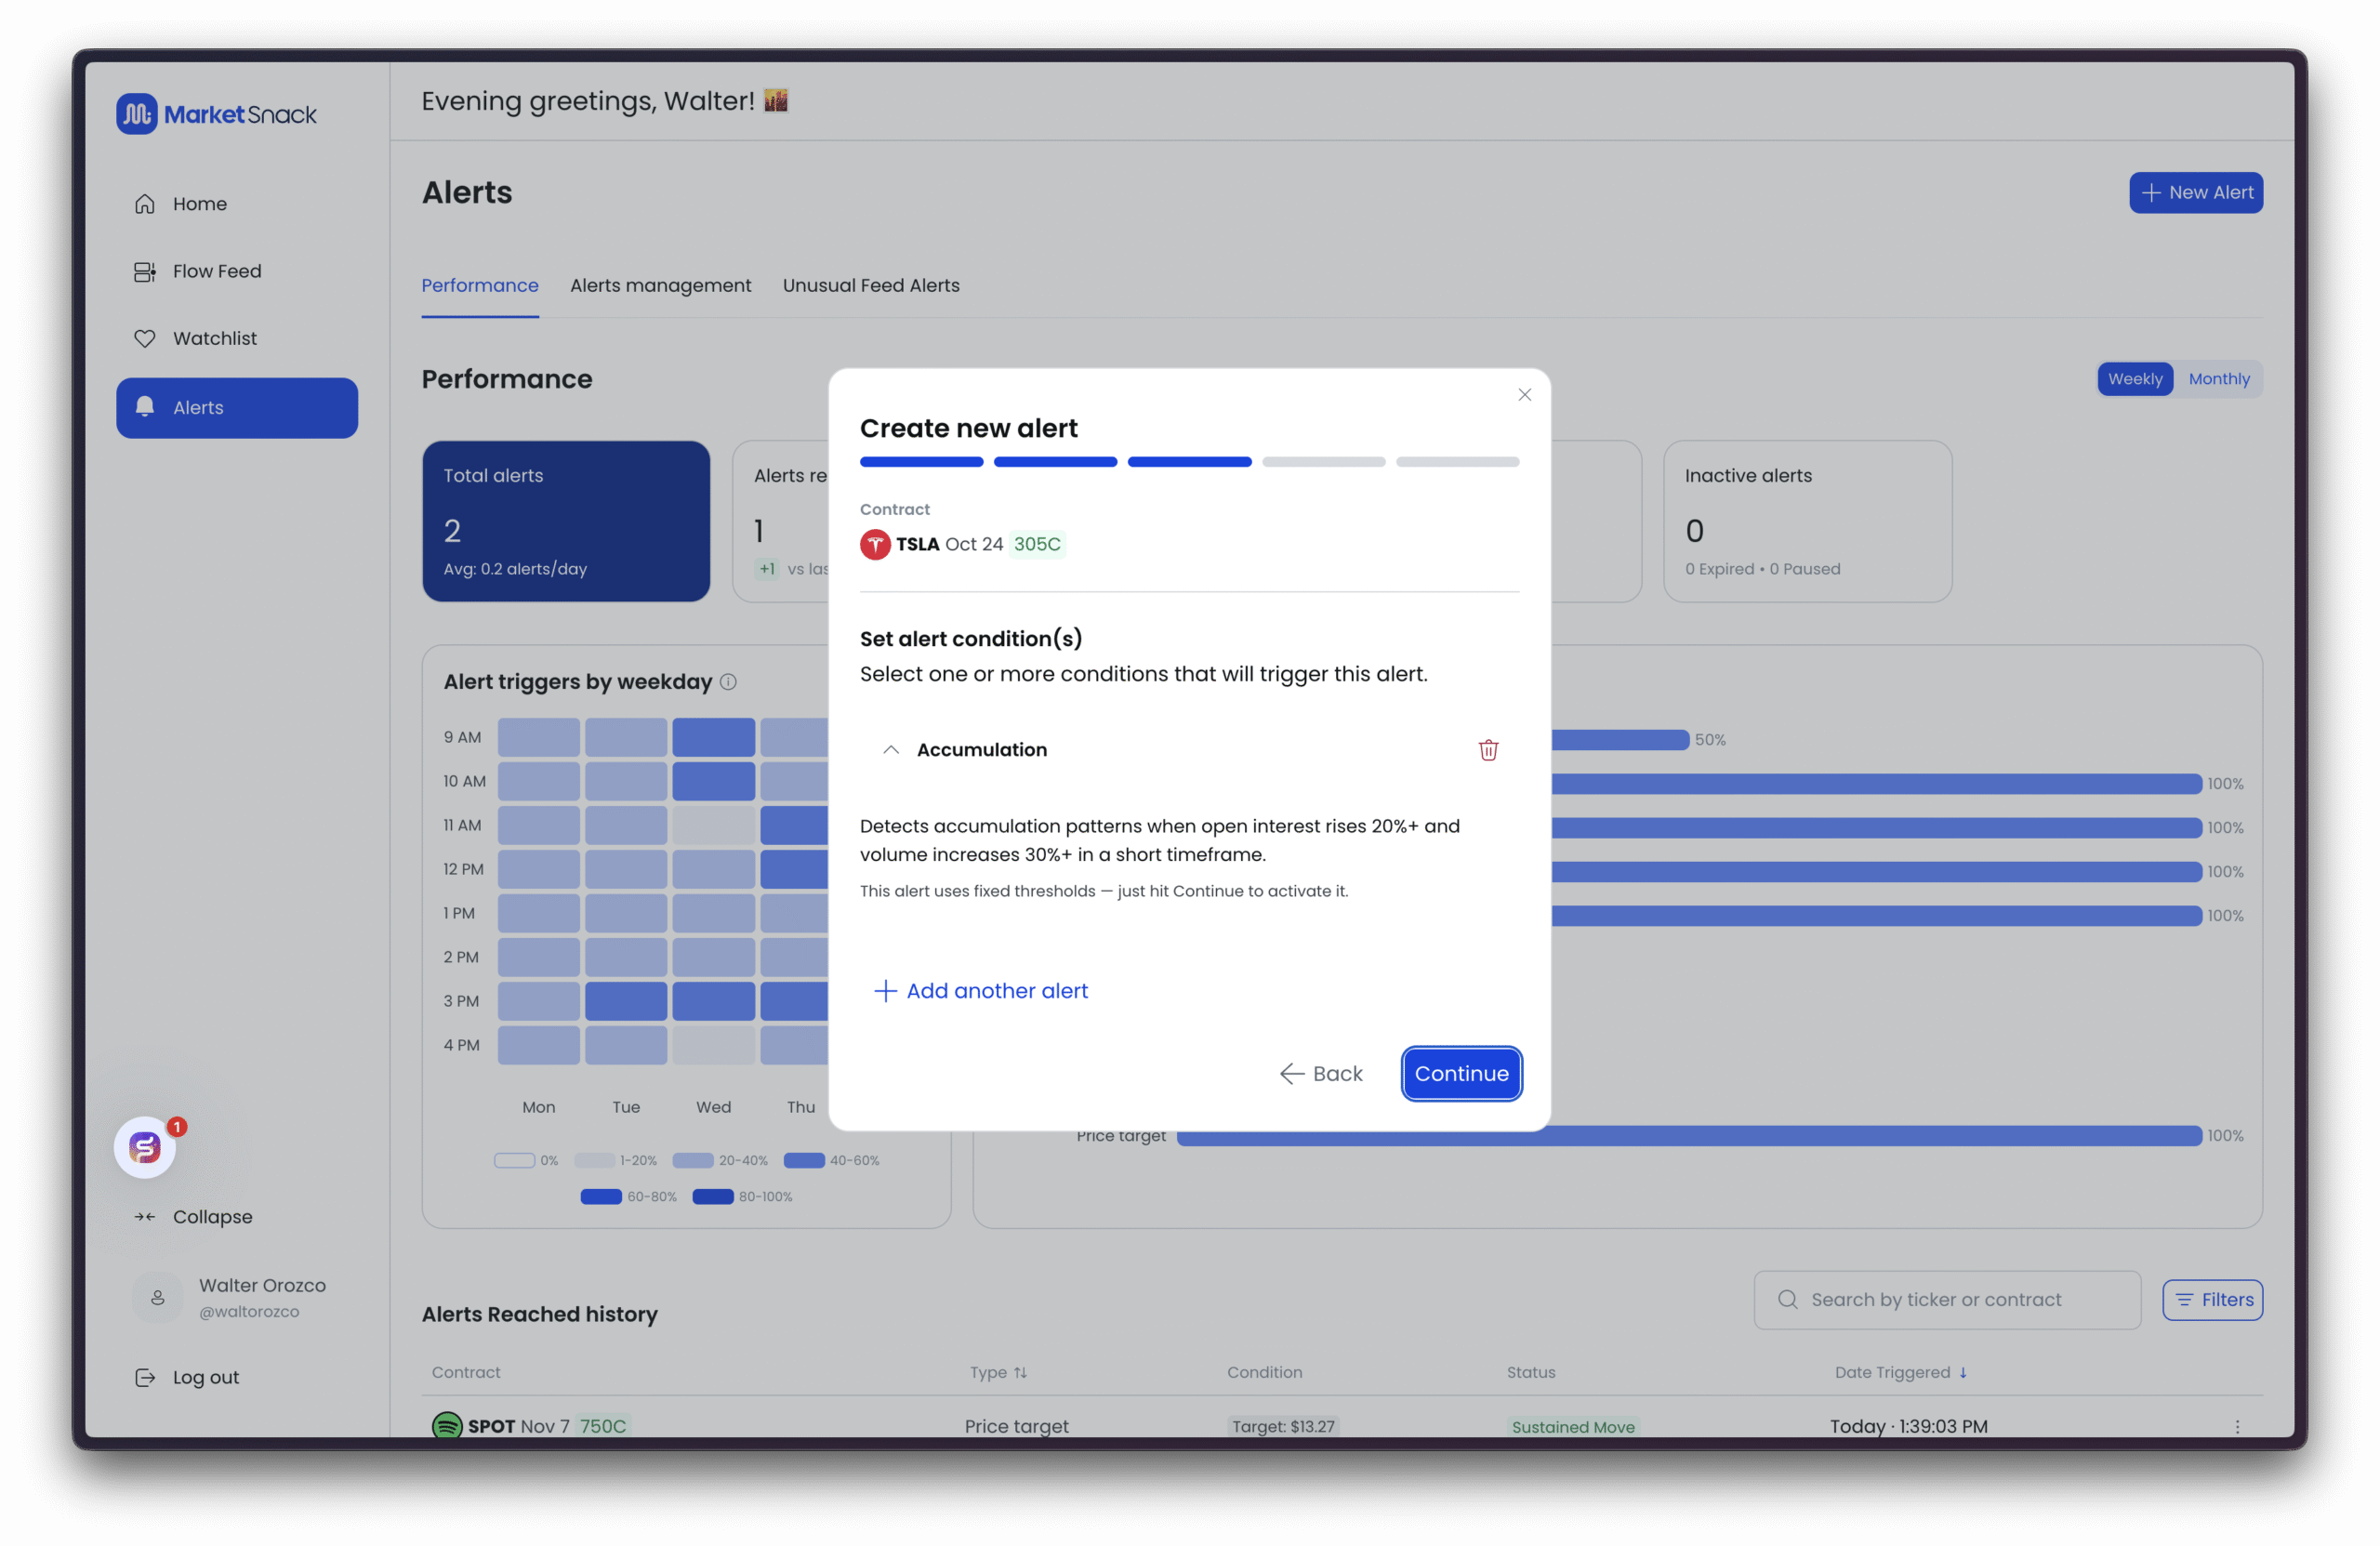
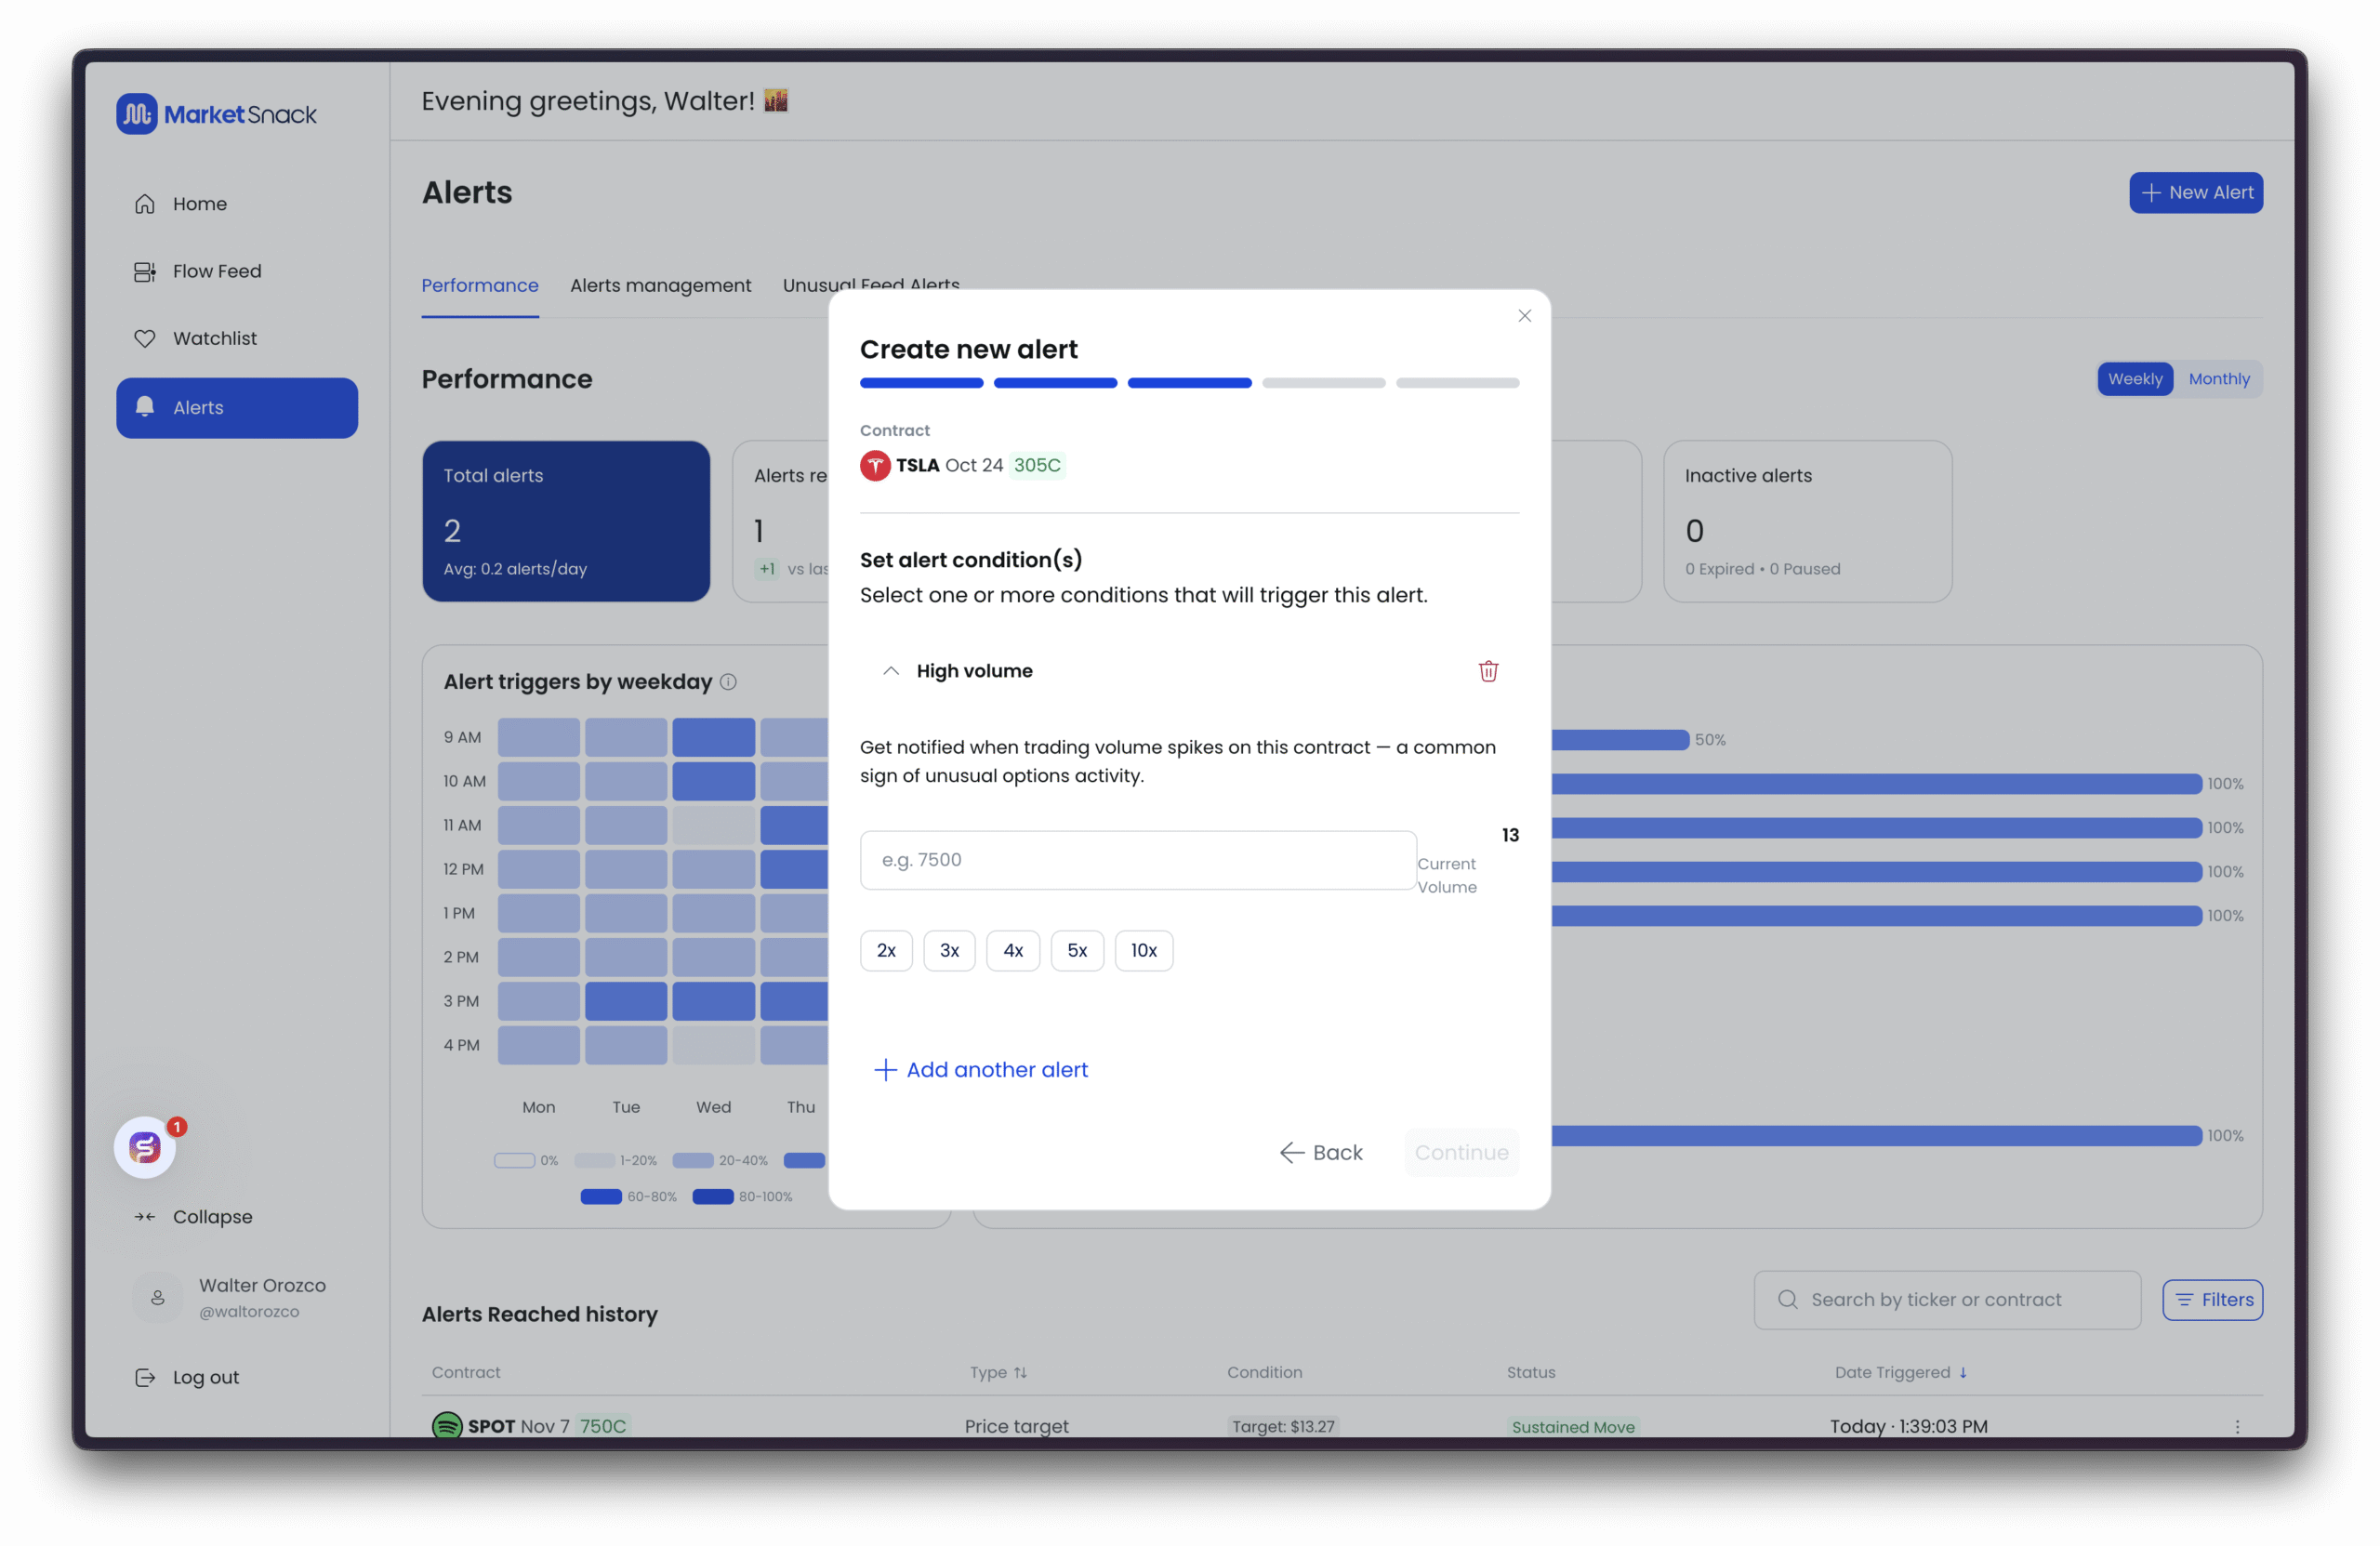
● High Volume – Fires when the contract’s trading volume exceeds your defined threshold for the day.
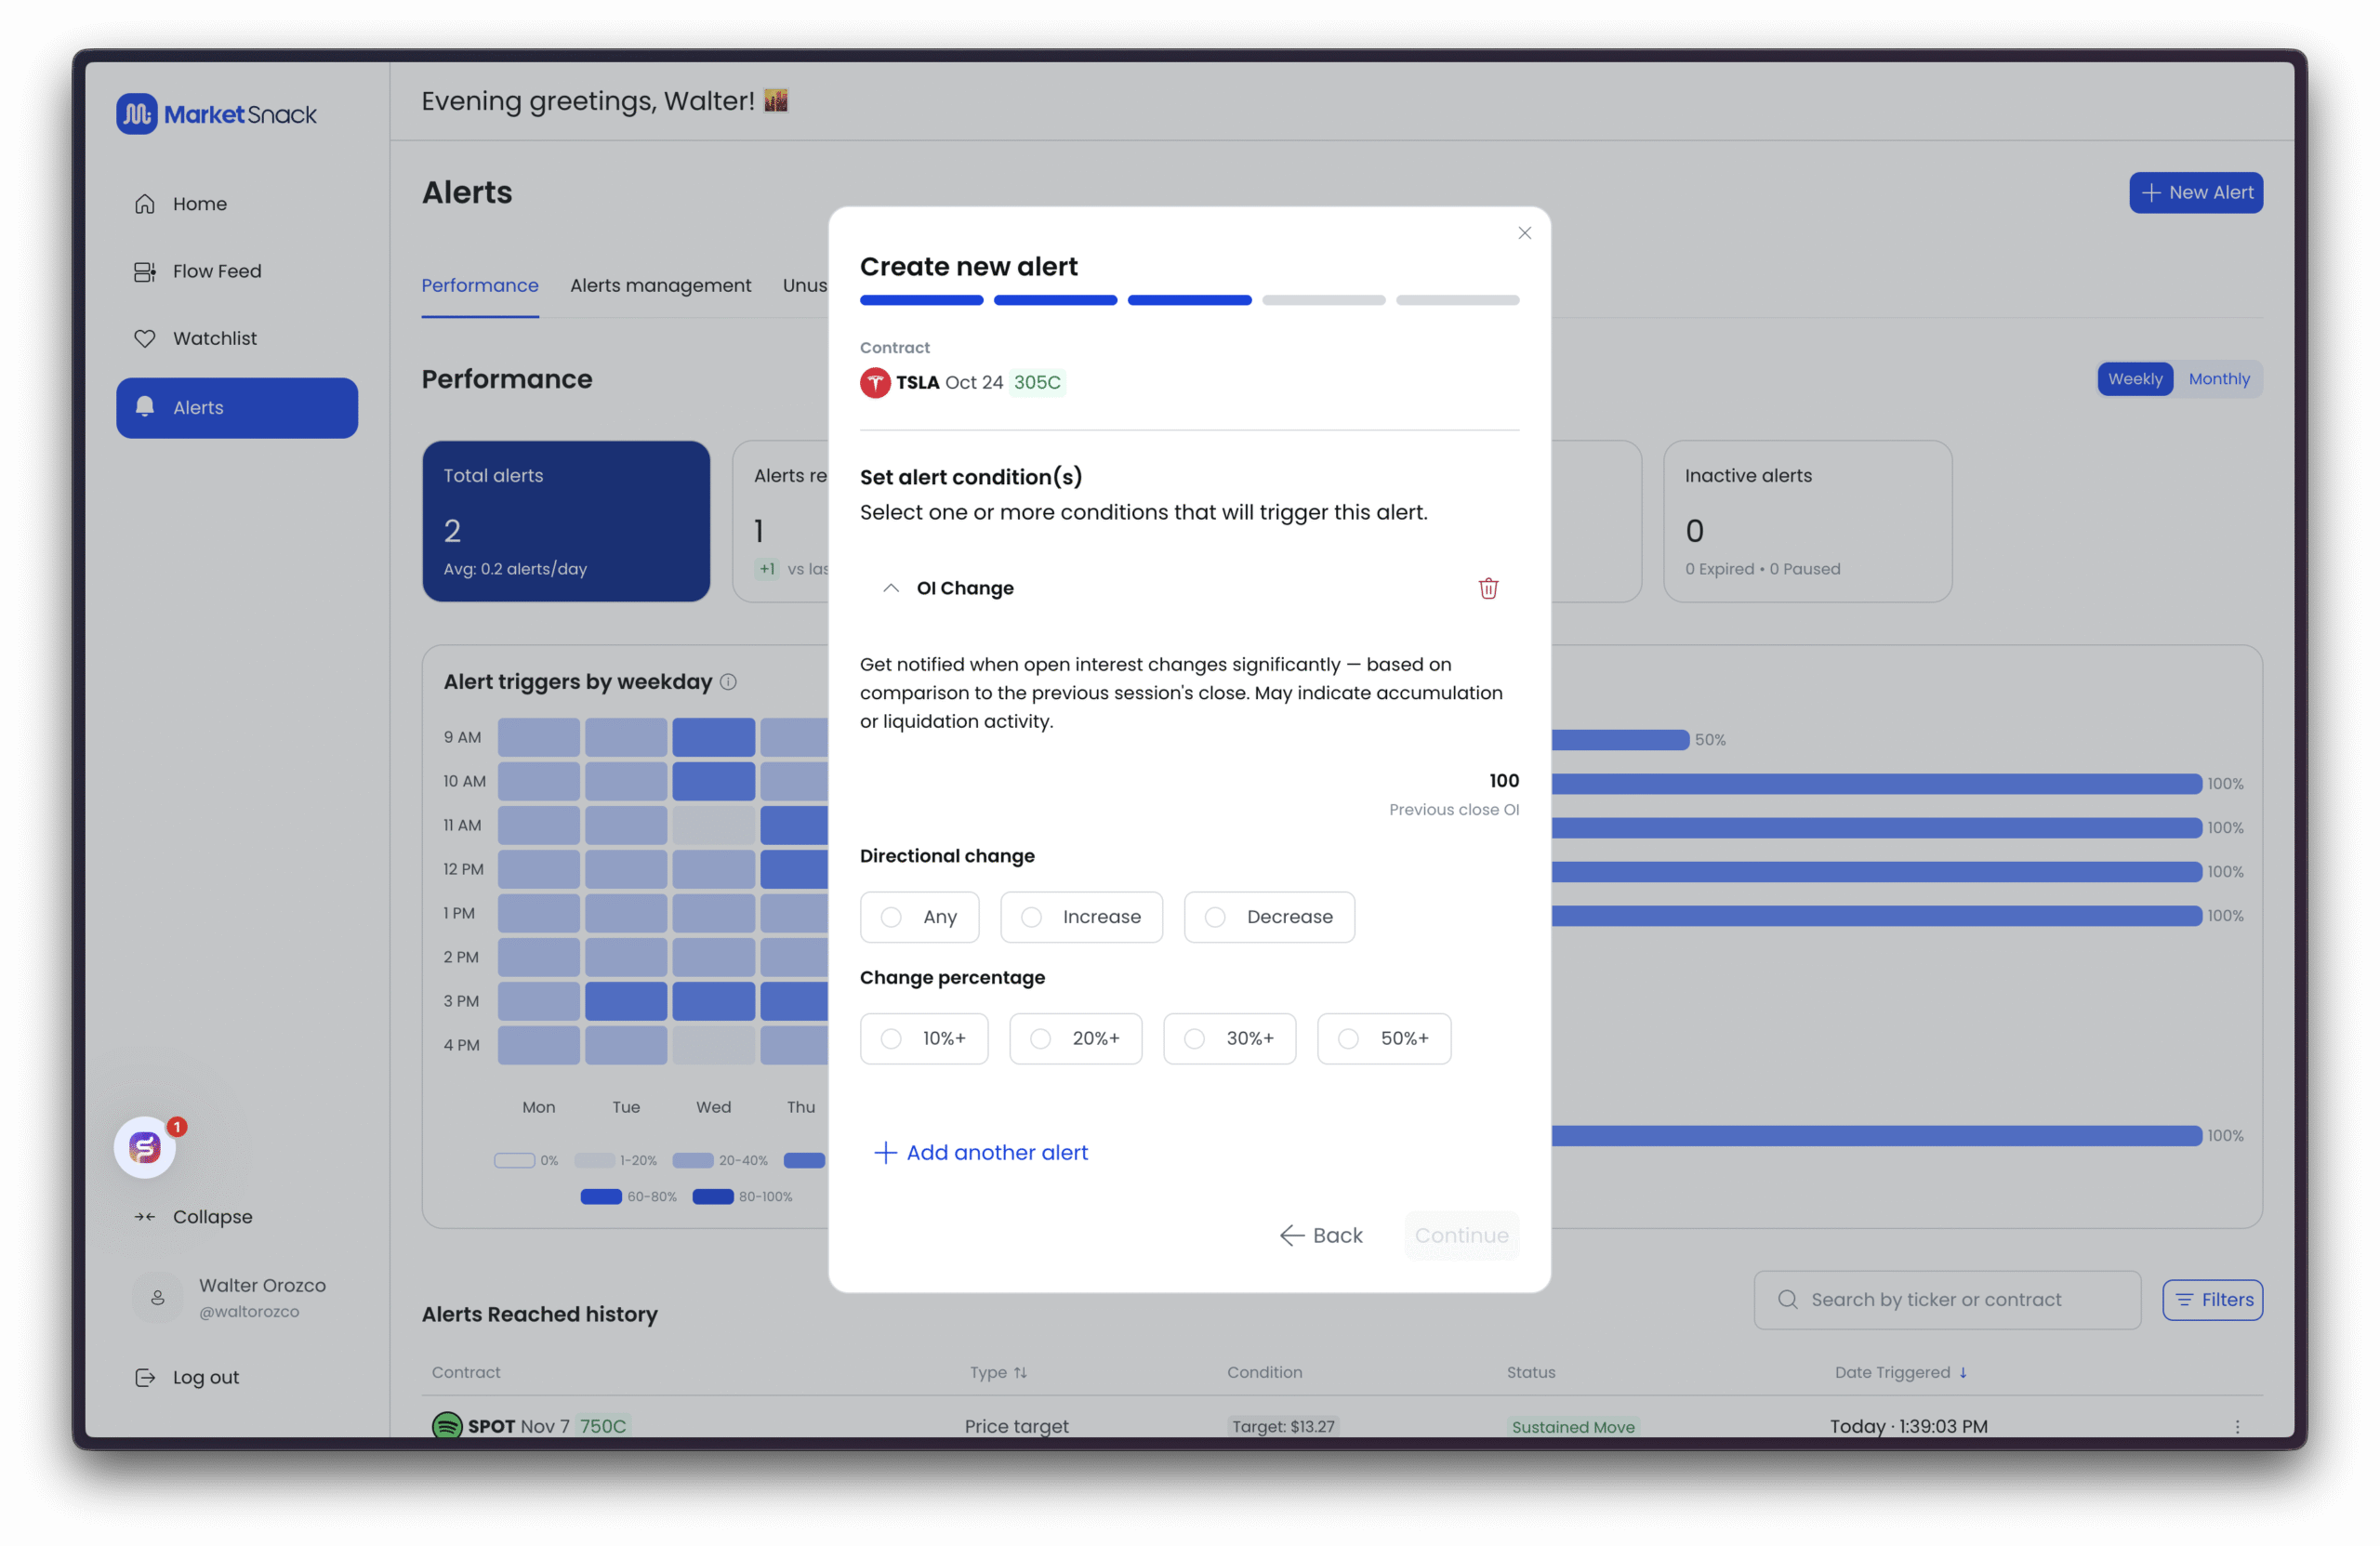
● OI Change – Alerts you to significant increases or decreases in Open Interest (OI), indicating new position building or unwinding.
● Price Drop – Notifies you when the option price falls below a set level.

● Price Target – Triggers when the contract reaches a specific price level you define.

You can also combine multiple alerts on the same contract. For example, you could set both a Price Target and an OI Change alert for a single option, ensuring you capture different types of signals without having to track them manually.
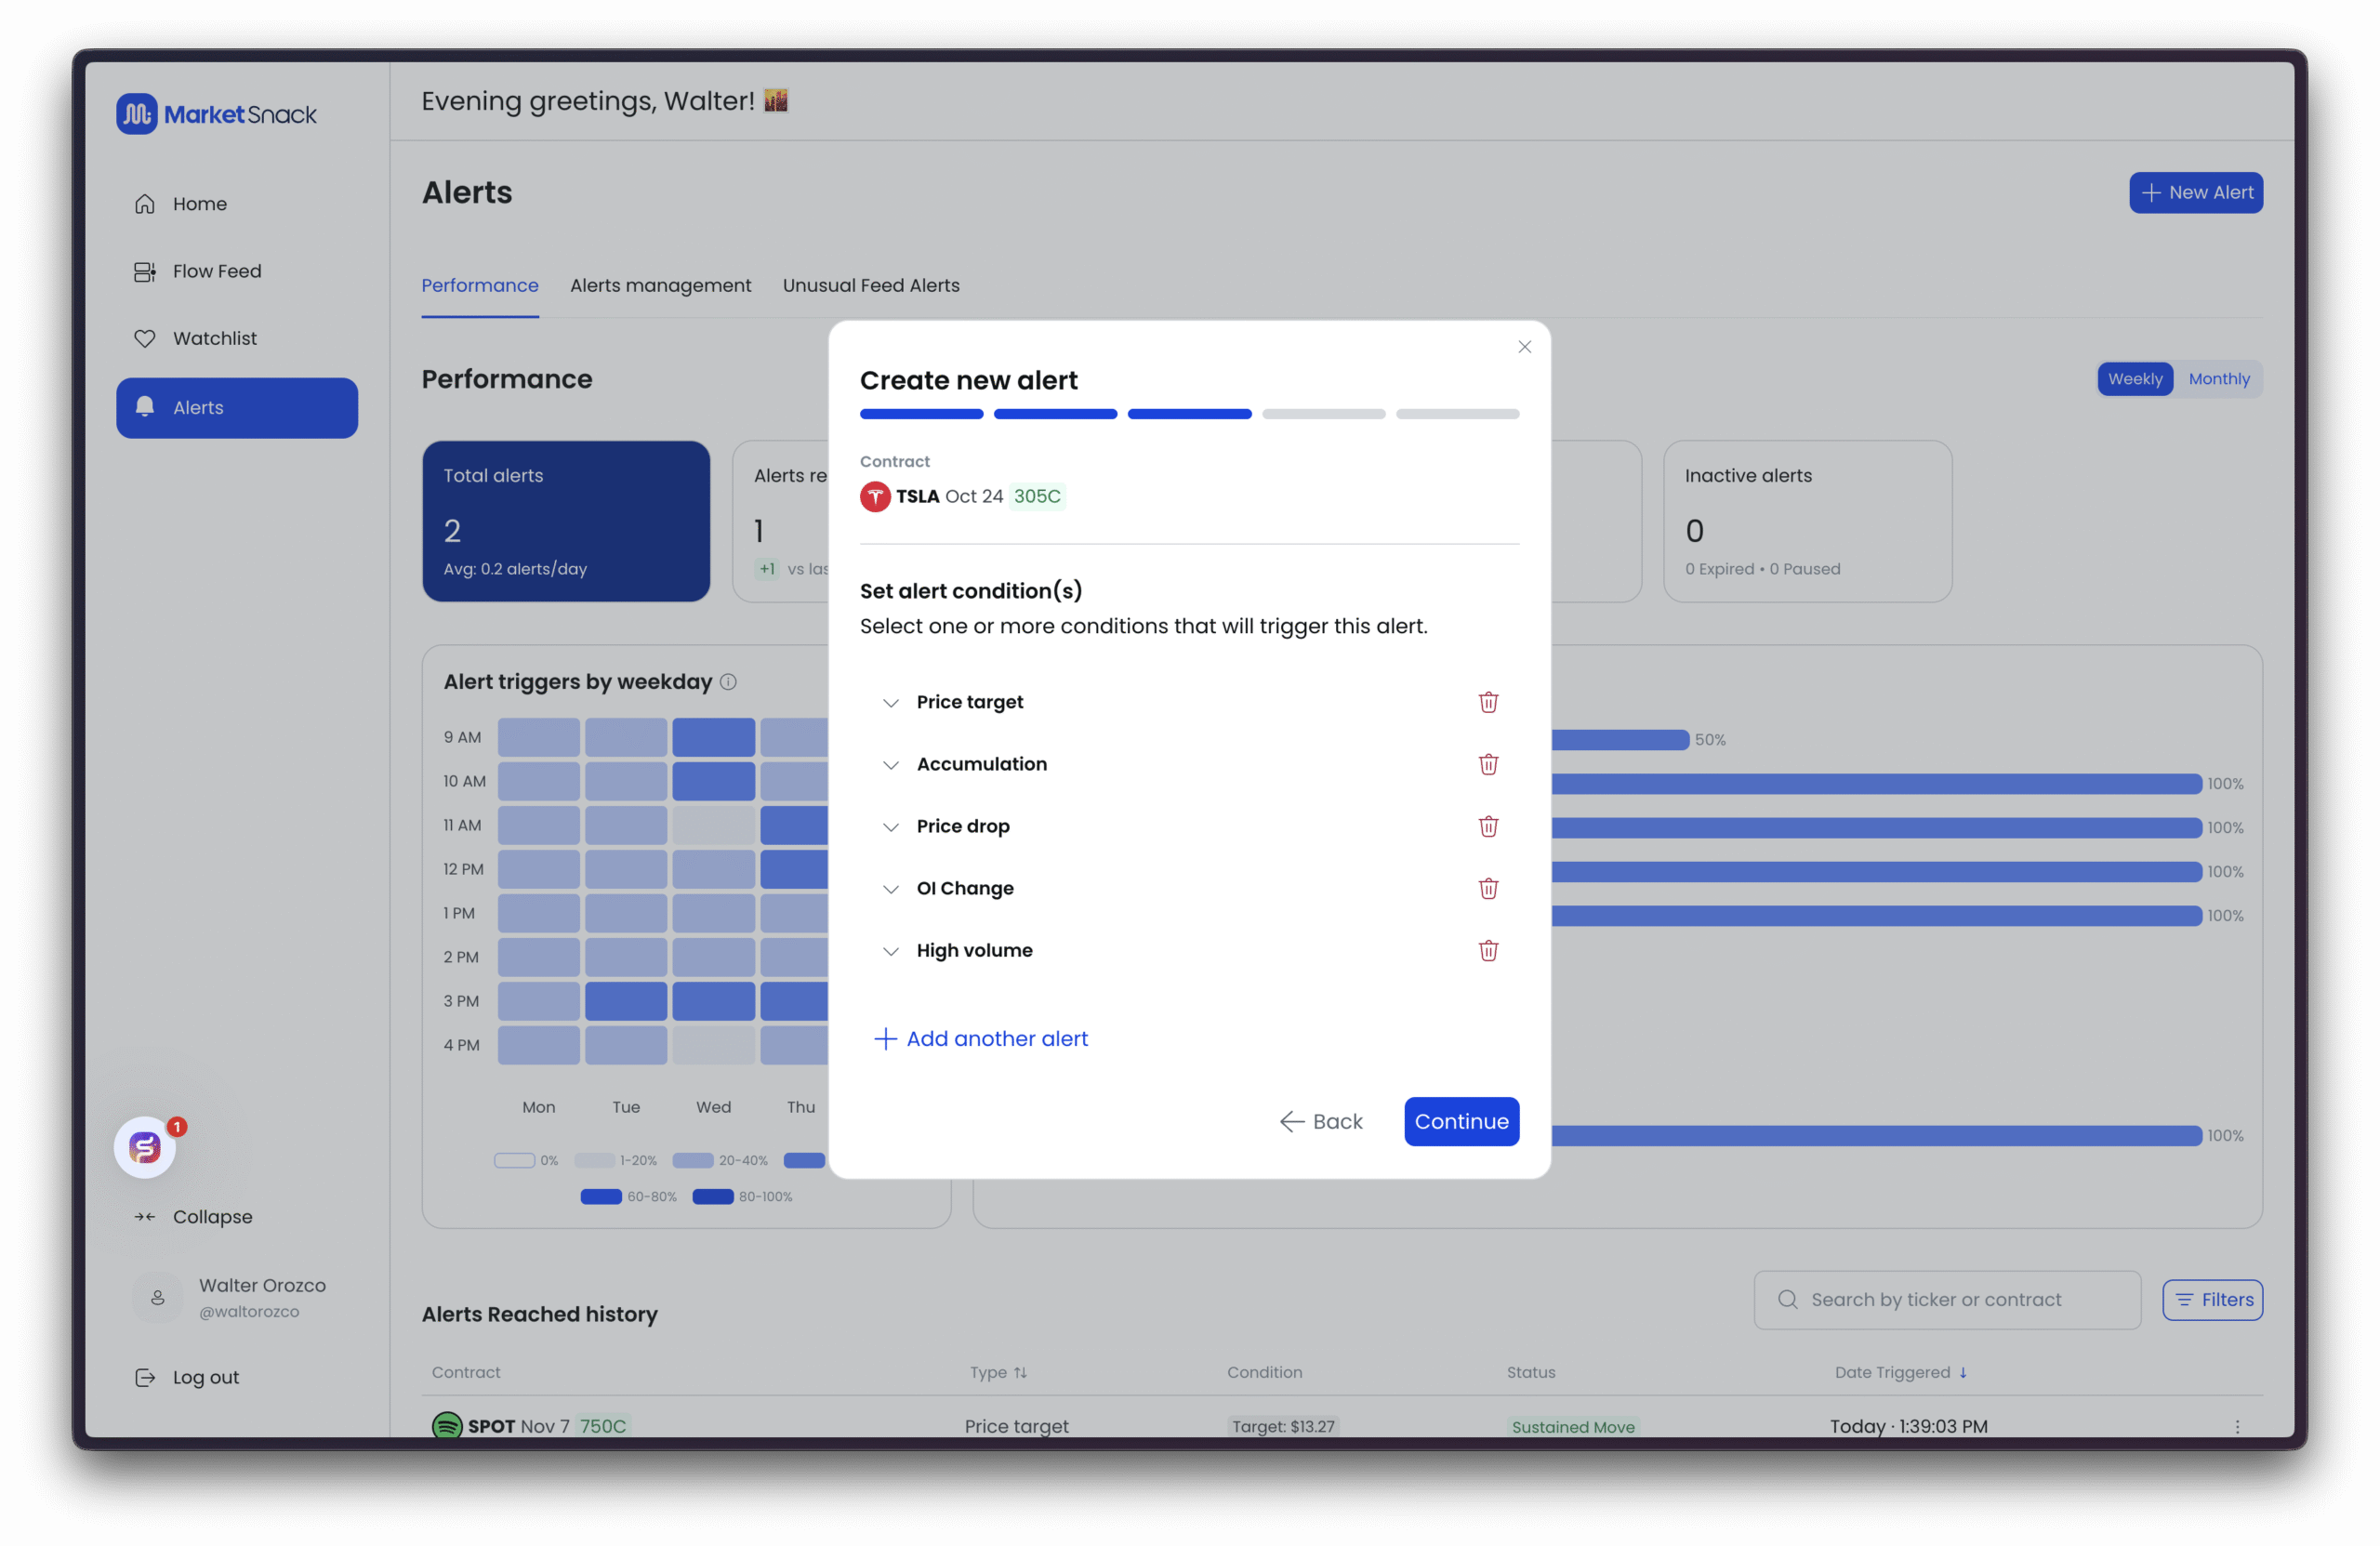
Once an alert is created, it will appear under Alerts Management, where you can review, edit, or delete it as needed.
Managing Alerts
Once created, all alerts appear under Alerts Management. From here you can:
● View active alerts and triggers in real time.
● Edit or delete alerts (note: deleting is not reversible).
● Choose notification method (in-app, email, or SMS – SMS limited by user quota, others unlimited).
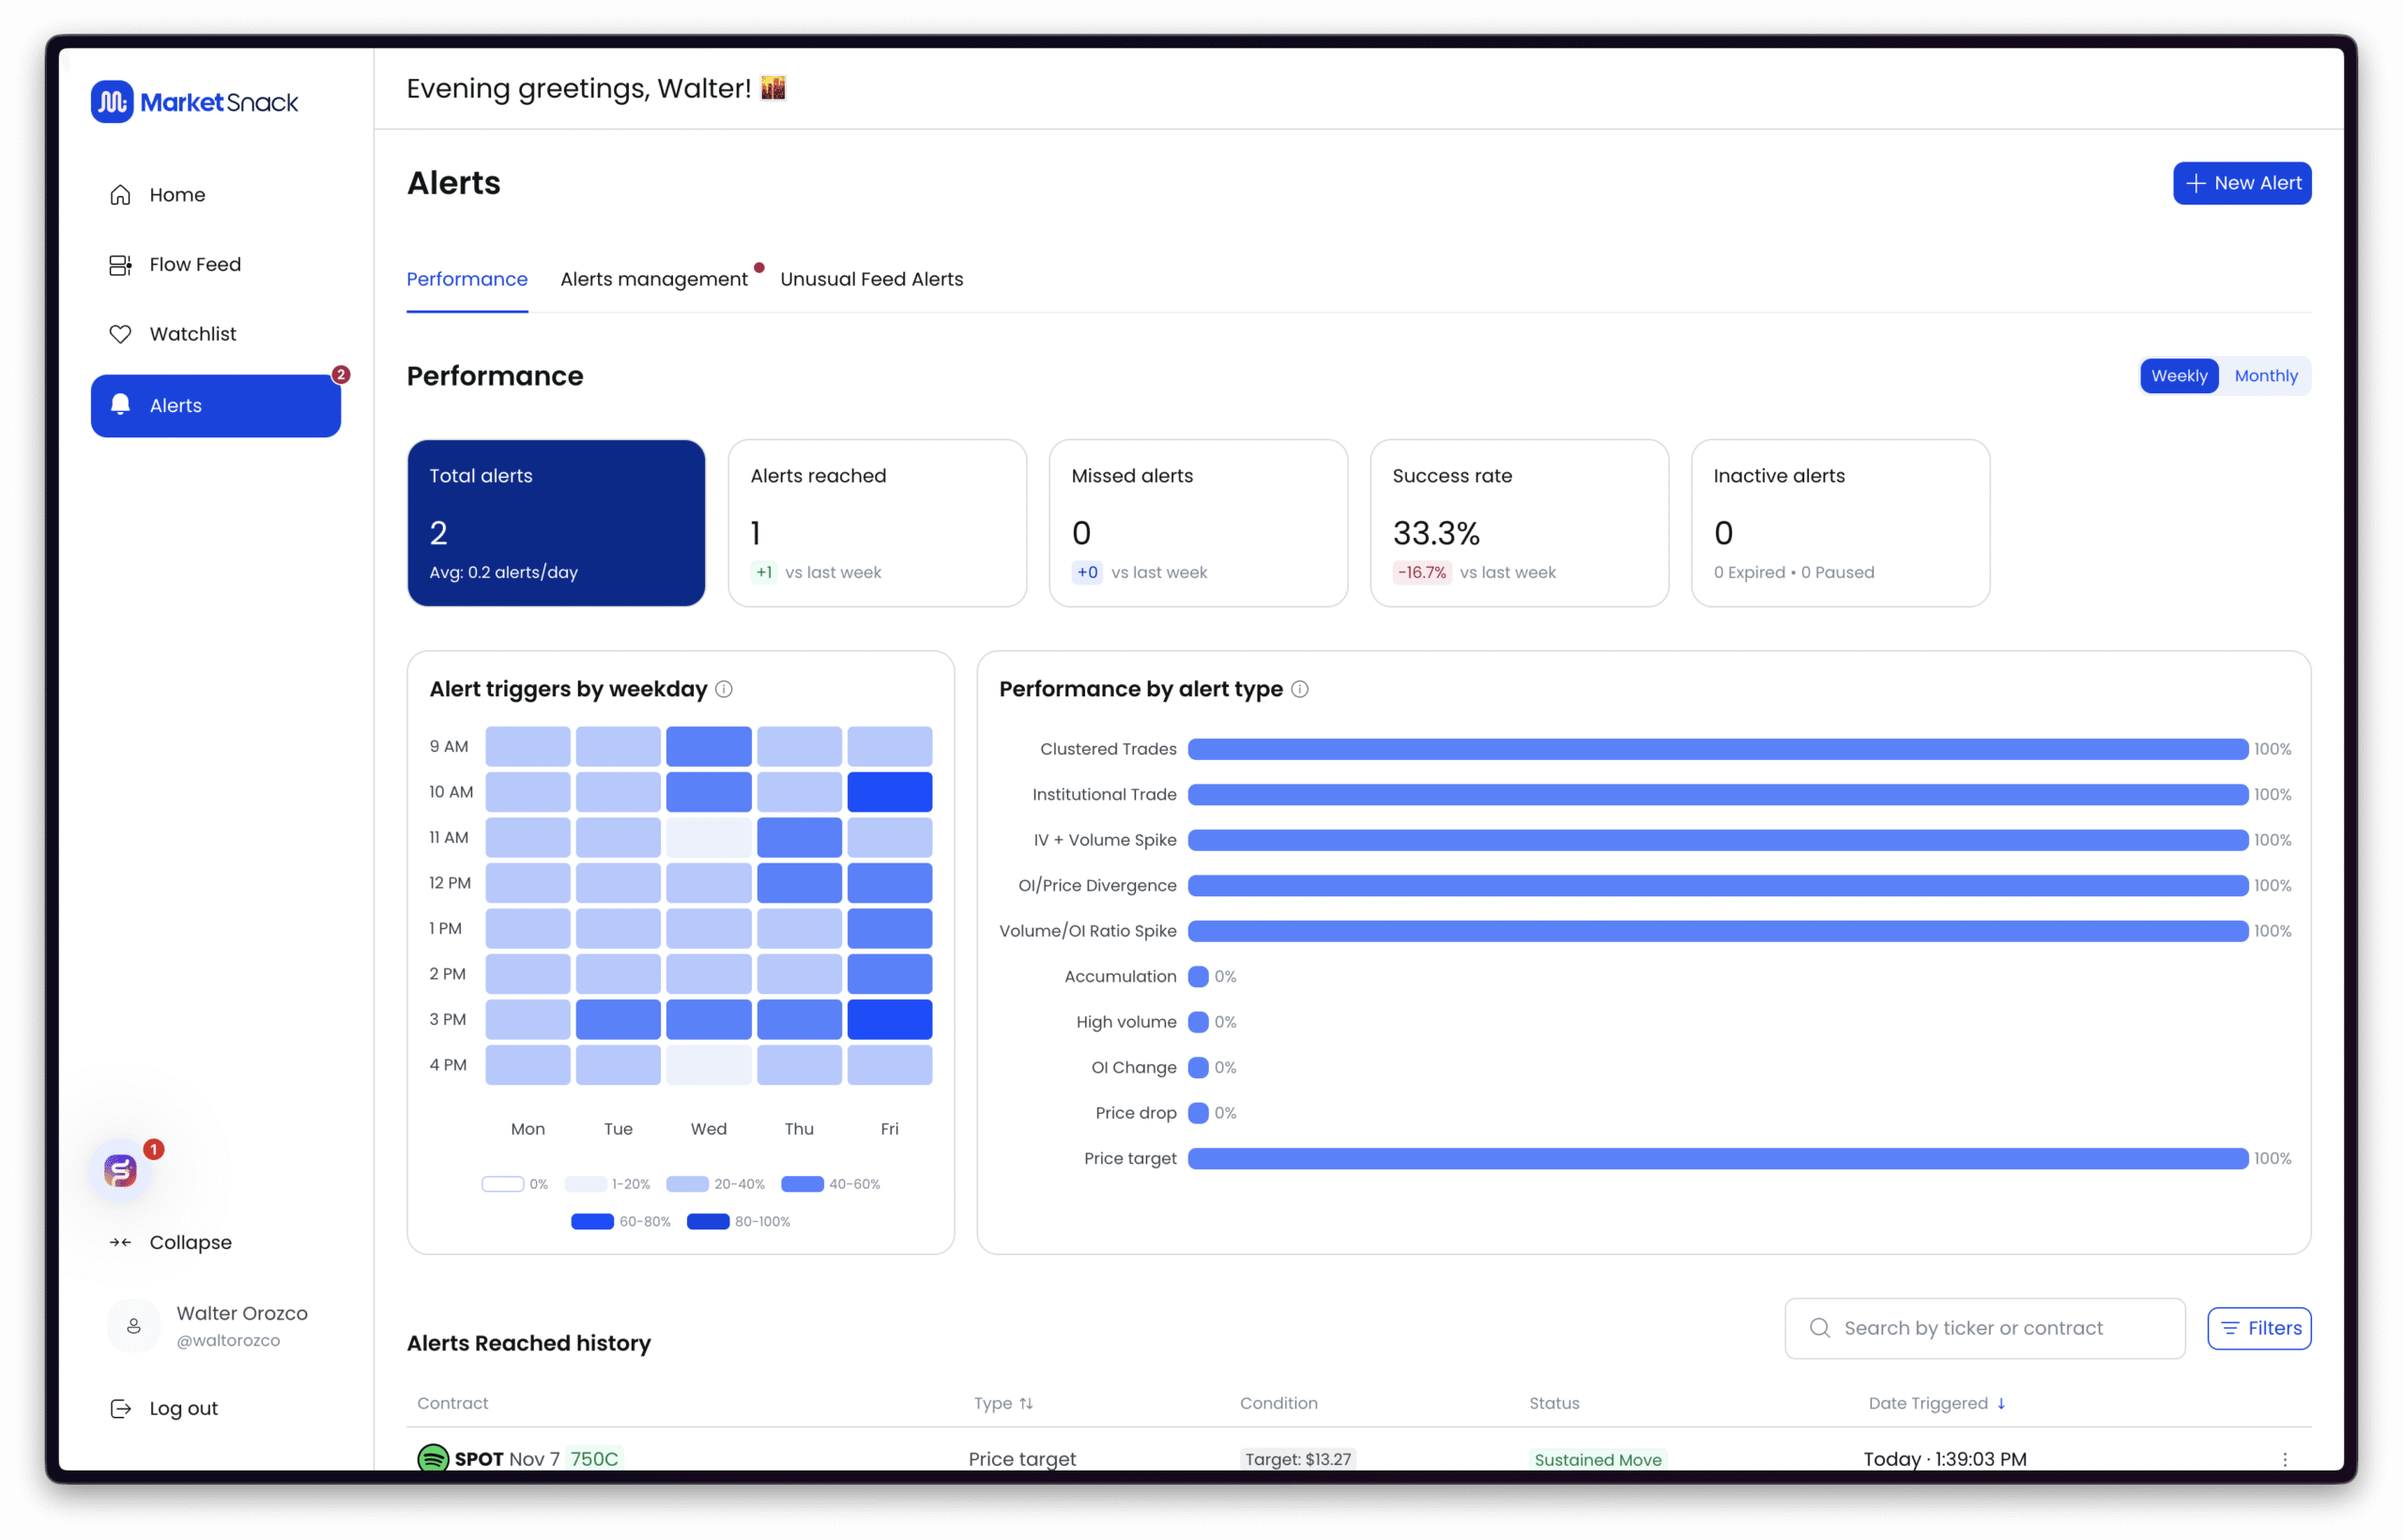
Alerts Performance (Weekly / Monthly)
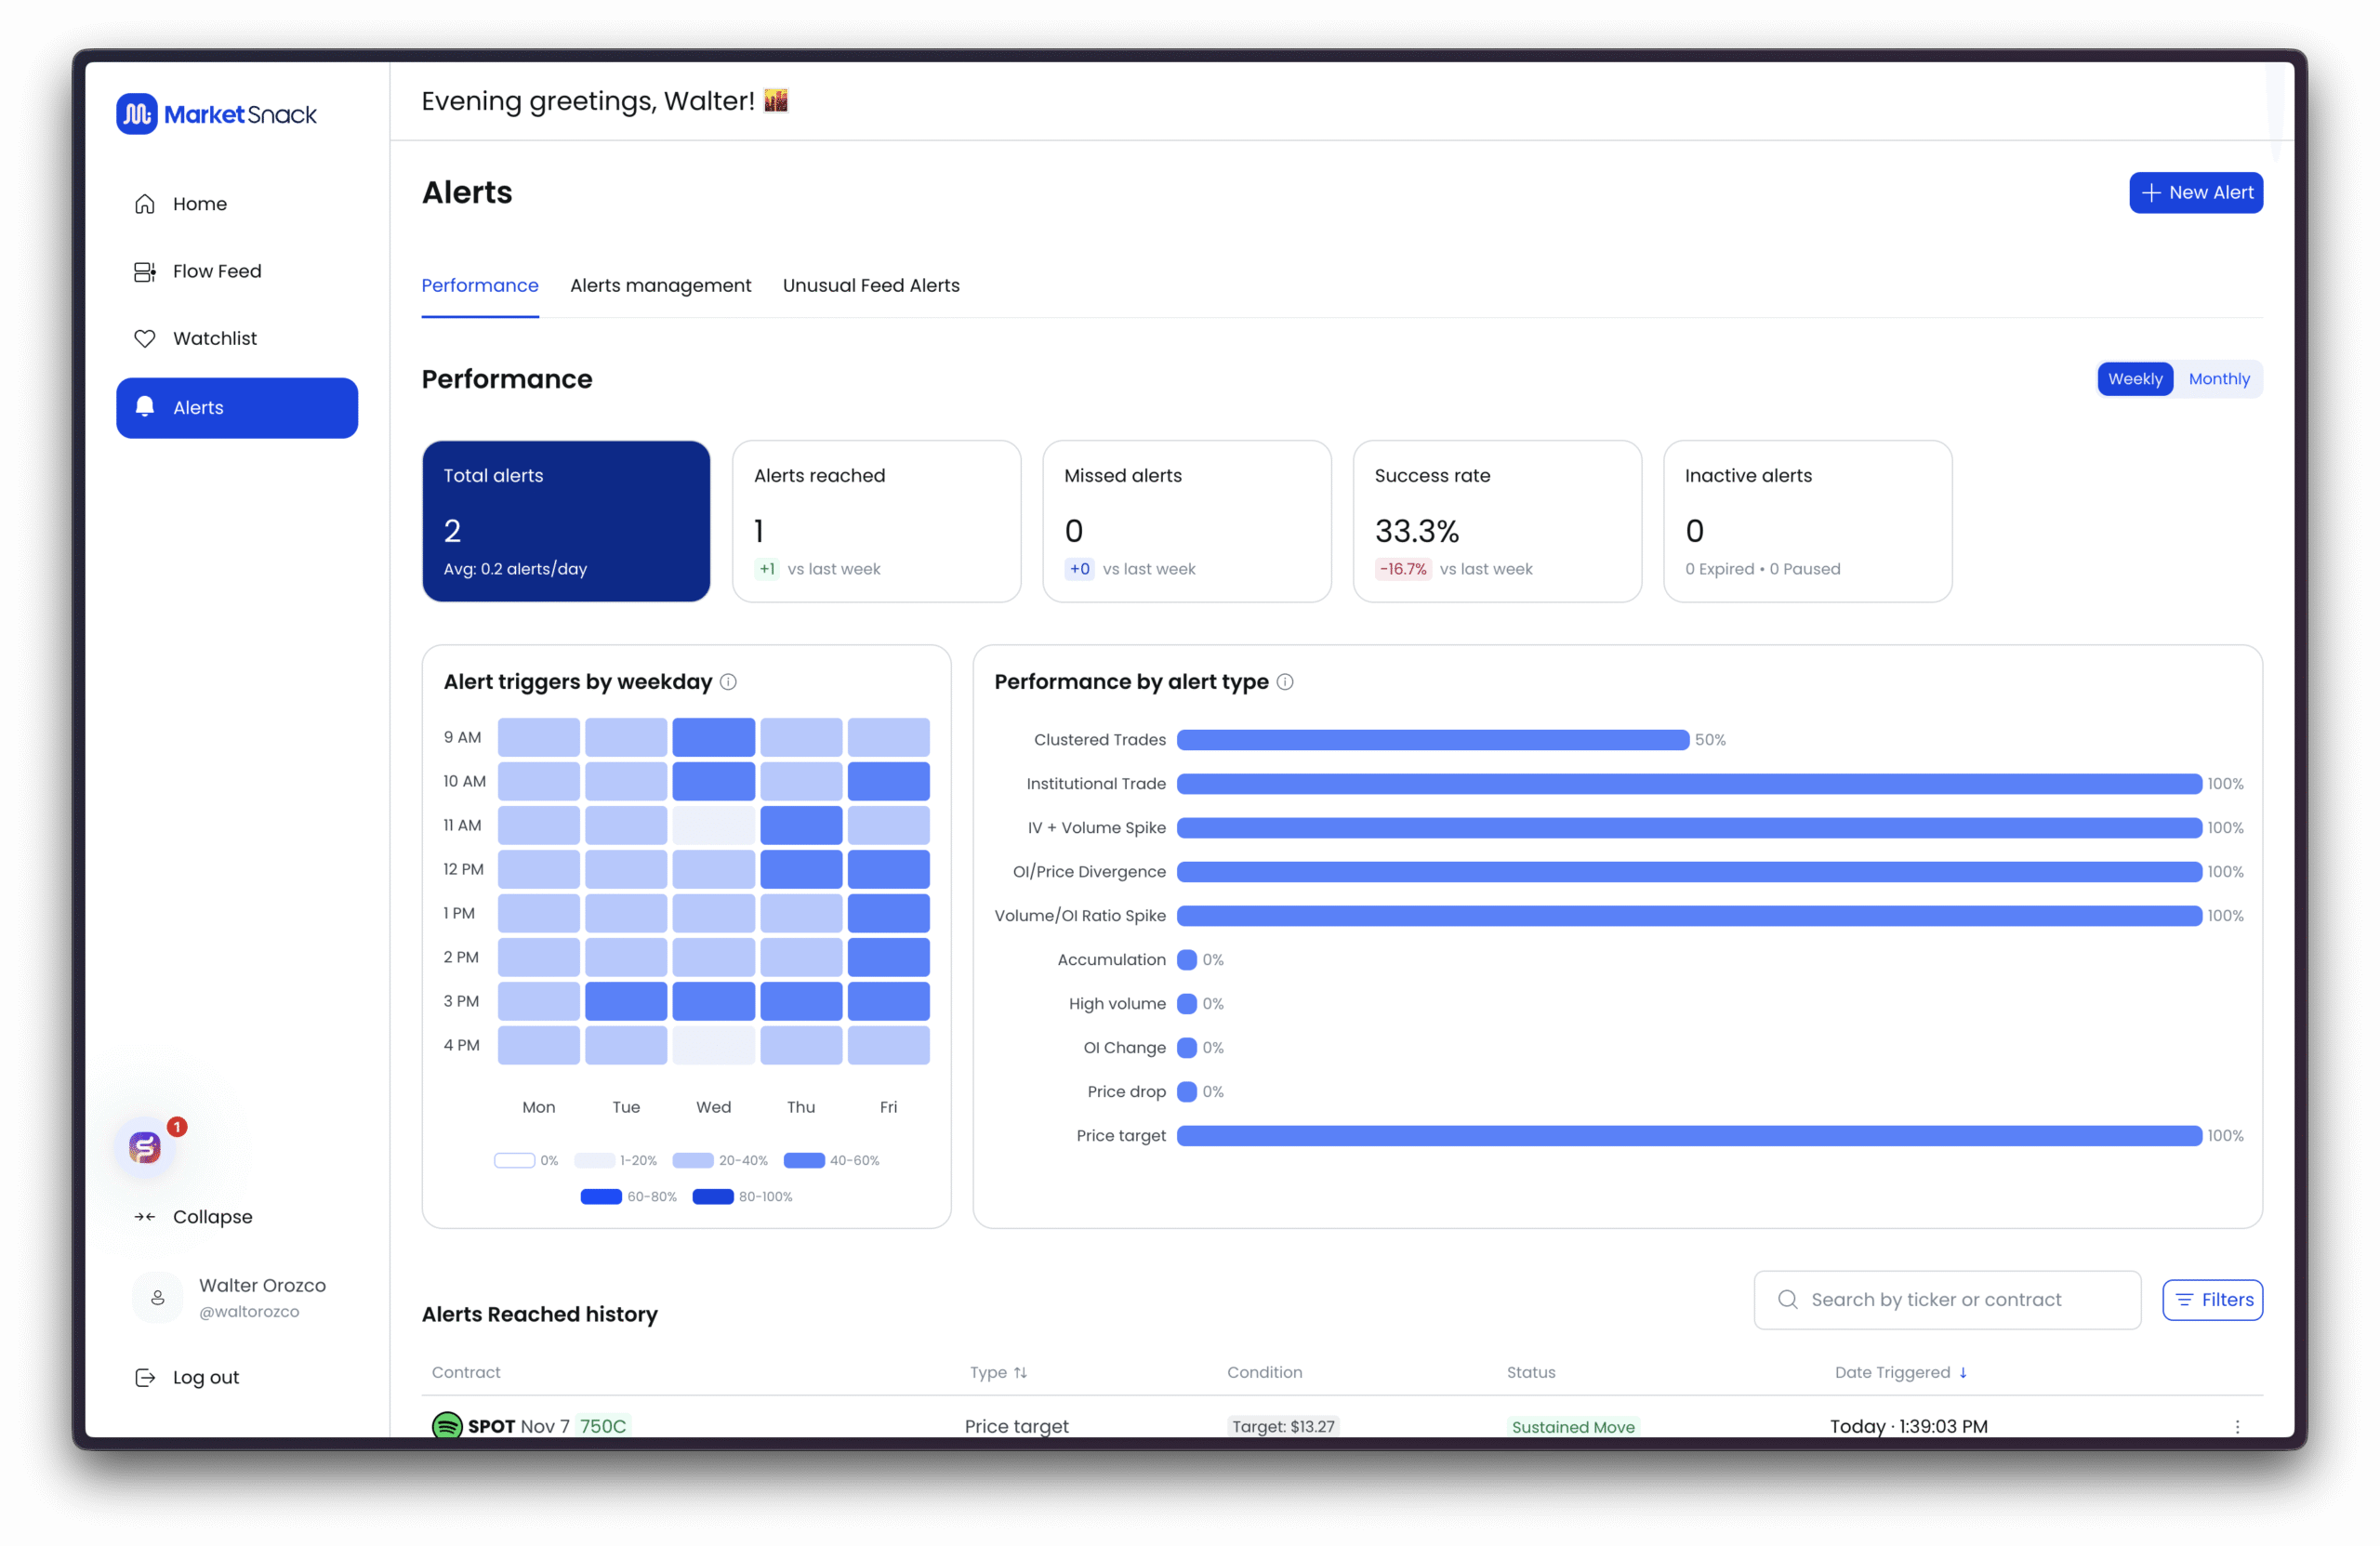
The Performance tab gives a structured overview of alert effectiveness:
● Period – Switch between Weekly or Monthly.
● Total Alerts – Number created in the period, with average per day.
● Alerts Reached – How many alerts actually triggered.
● Missed Alerts – Alerts set but never triggered (conditions unmet).
● Success Rate – % of alerts reached vs. total evaluated.
● Inactive Alerts – Expired or paused alerts.
● Alert Triggers by Weekday (heatmap) – Shows when alerts most often fire.
● Performance by Alert Type – Distribution of signals by alert type.
● Search by Ticker/Contract – Filter performance by symbol.
● Filters – Refine by date range, alert type, status, or asset.
Unusual Feed Alerts
The Unusual Feed Alerts section highlights option trades that stand out from normal market activity. These signals are designed to help you quickly identify unusual flows and spot potential opportunities without having to sift through all the noise.
Top 5 Unusual Trades
This widget shows the five most unusual trades ranked by score. Each card displays:
● Ticker and expiration date
● Strike price
● Premium
● Price
● Size (contracts)
● Unusual Score (0–100)
● Side (Bid/Ask/Mid)
This snapshot allows you to quickly see the trades generating the highest unusual activity and where to focus your attention first.
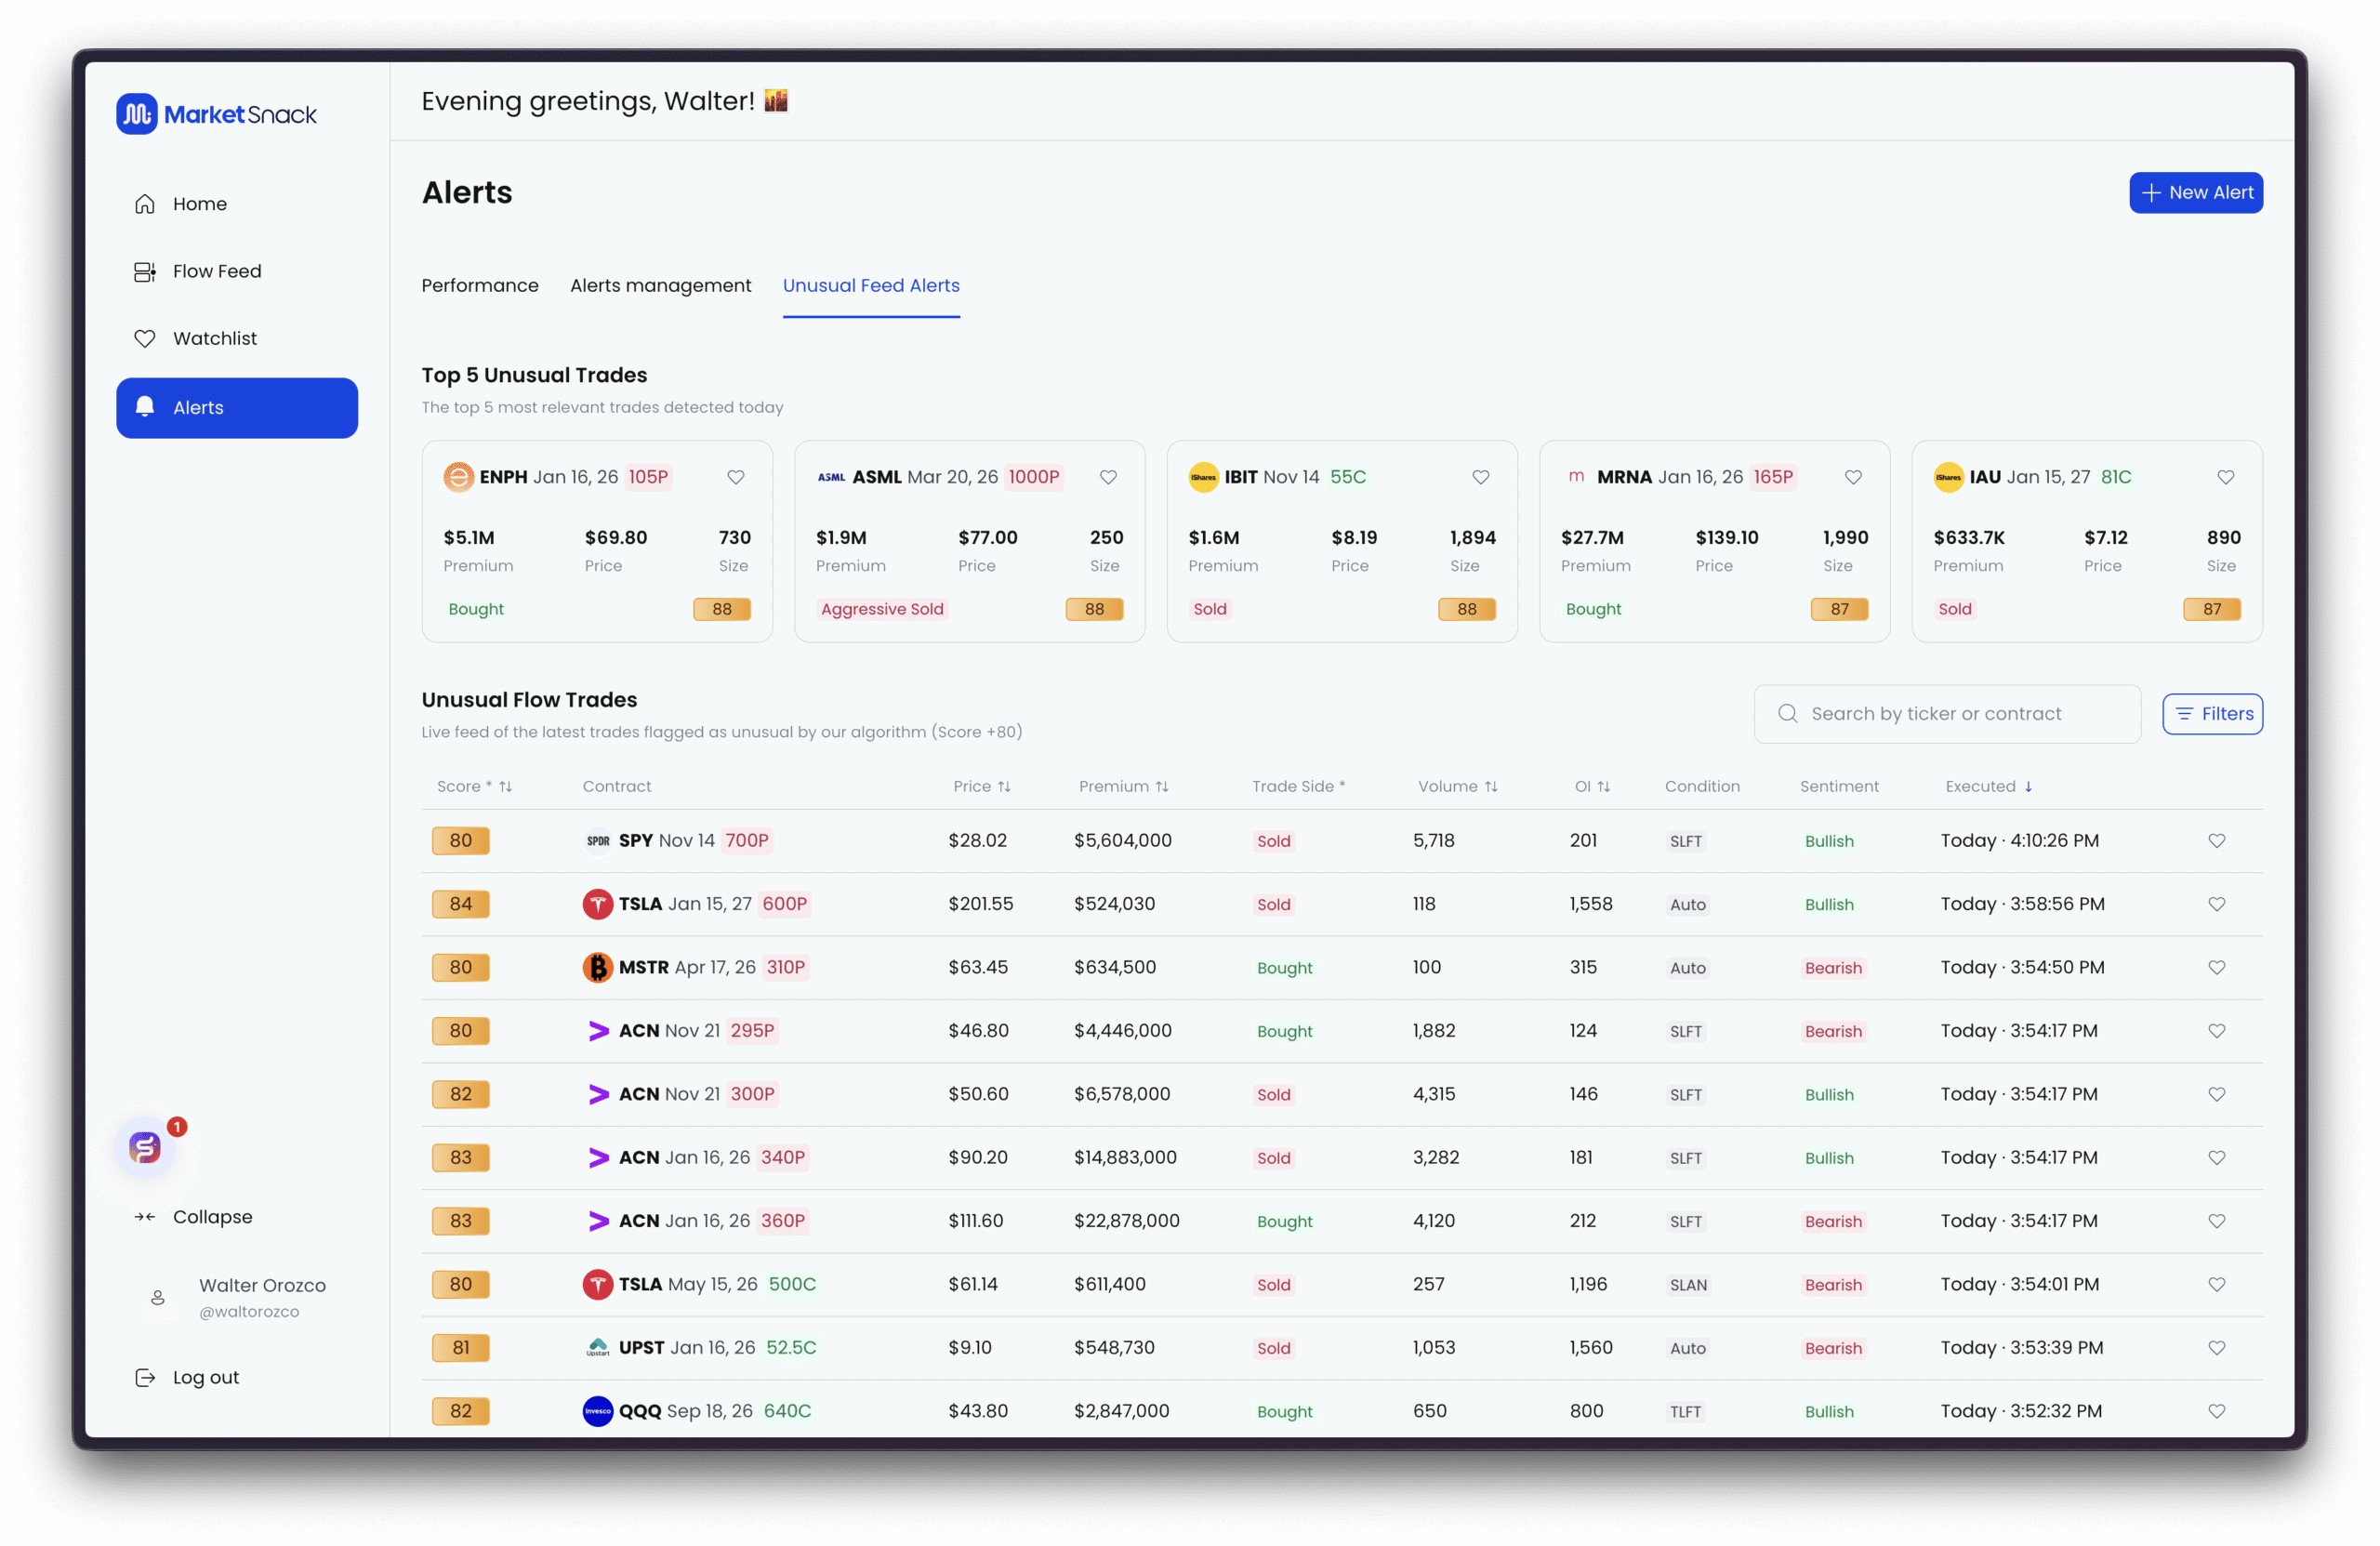
Unusual Flow Trades
This section provides a chronological table of unusual trades detected throughout the session. Each row displays:
● Score – the unusual activity score (0–100).
● Contract – ticker, expiration, strike, and type (Call/Put).
● Price – trade execution price.
● Premium – notional value of the trade.
● Side – whether it executed at the Bid, Mid, or Ask.
● Volume – contracts traded.
● Open Interest (OI) – existing open contracts.
● Condition – execution condition from the exchange.
● Sentiment – overall directional tone (bullish/bearish/neutral).
● Executed – timestamp of the trade.
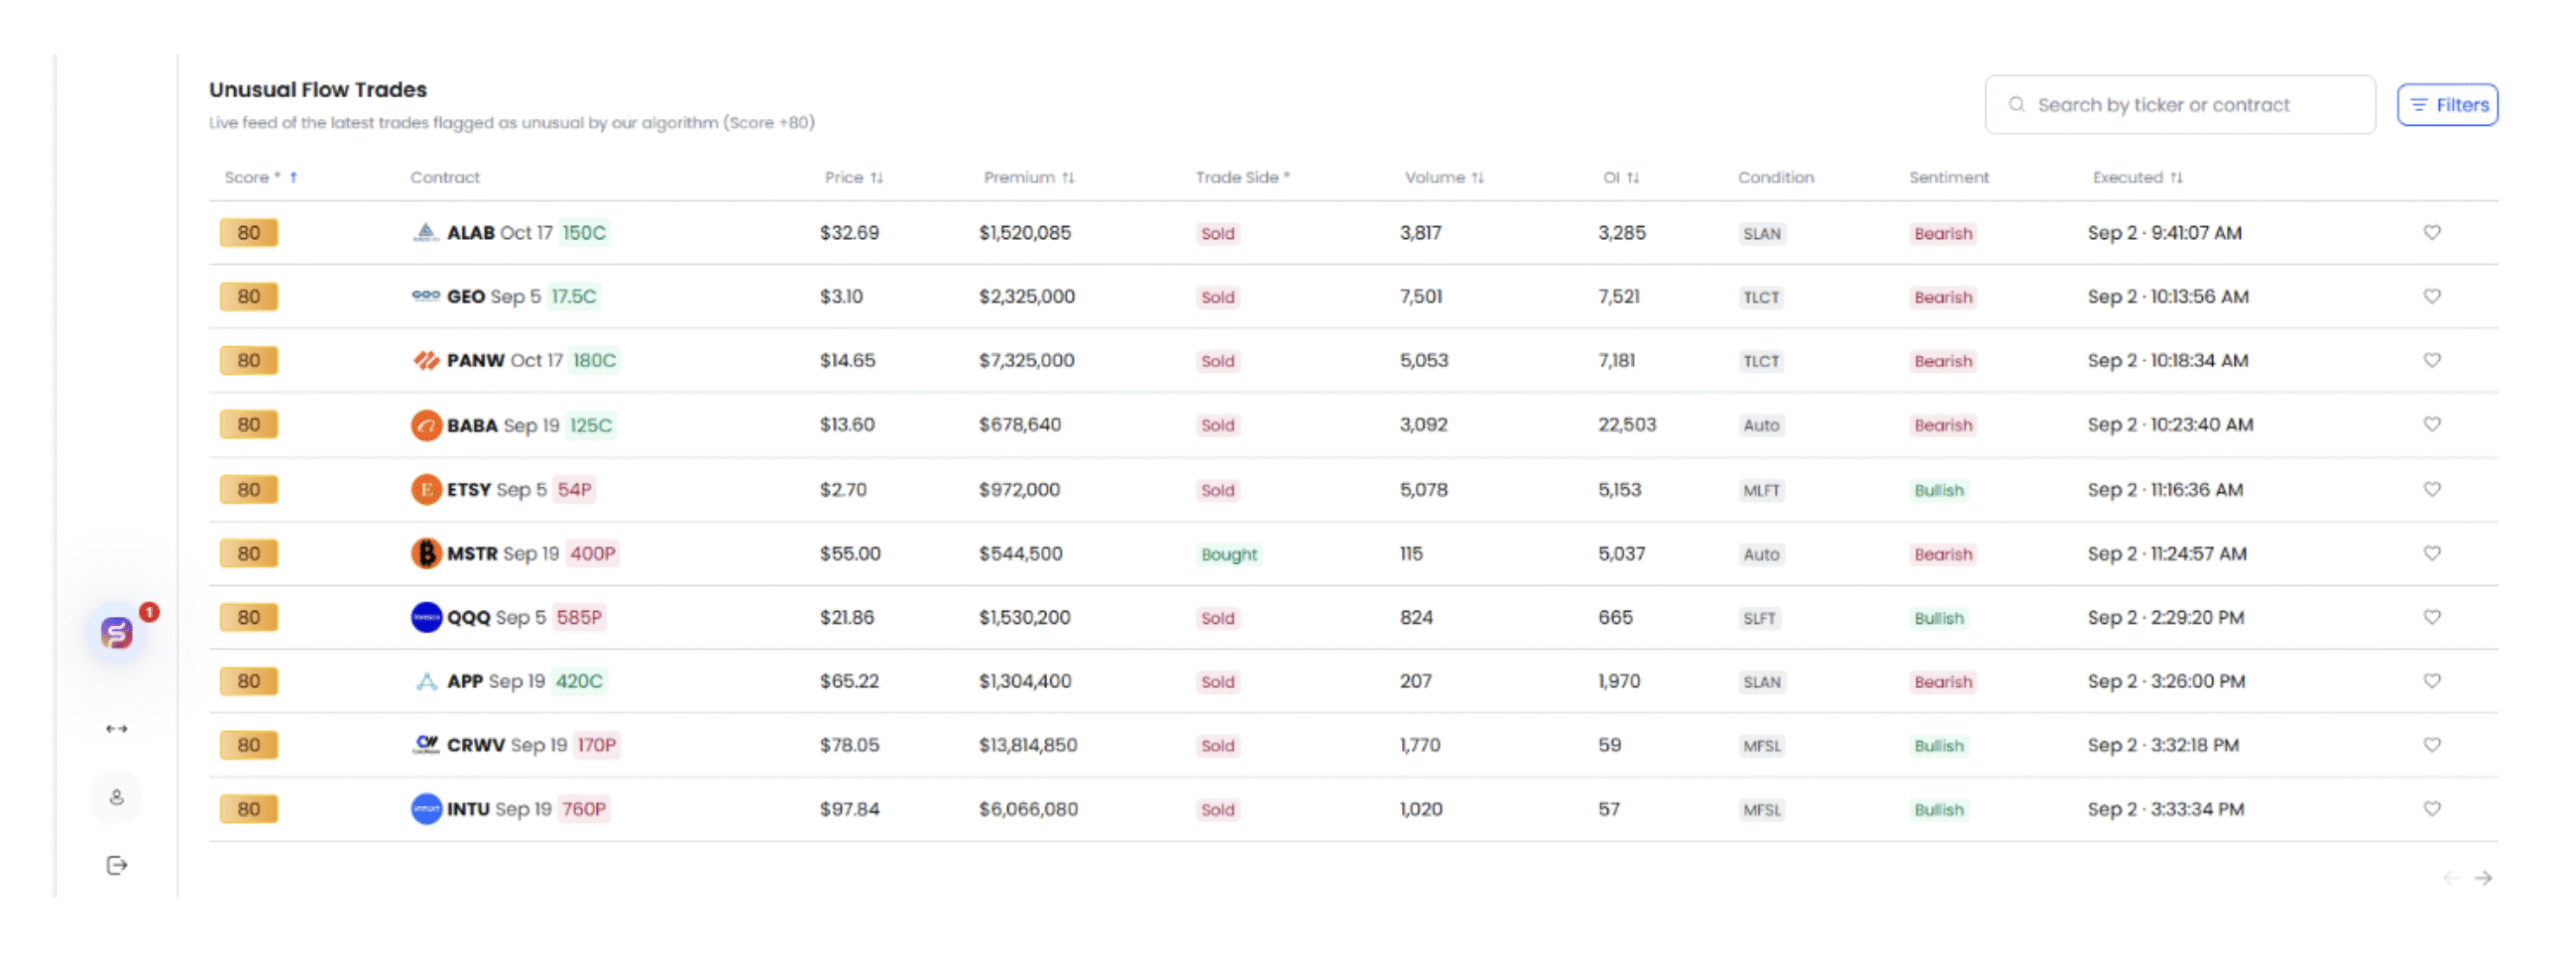
How to Use
● Look for high-score trades (80+) combined with large premium values.
● Pay attention to repeated prints on the same contract, which may signal accumulation.
● Cross-check with volume and OI to confirm whether unusual activity is backed by position building.